

HOT TOPICS LIST
- MACD
- Fibonacci
- RSI
- Gann
- ADXR
- Stochastics
- Volume
- Triangles
- Futures
- Cycles
- Volatility
- ZIGZAG
- MESA
- Retracement
- Aroon
INDICATORS LIST
LIST OF TOPICS
PRINT THIS ARTICLE
by Mark Rivest
Apple and Tesla recent action could signal an approaching bear market.
Position: N/A
Mark Rivest
Independent investment advisor, trader and writer. He has written articles for Technical Analysis of Stocks & Commodities, Traders.com Advantage,Futuresmag.com and, Finance Magnates. Author of website Four Dimension Trading.
PRINT THIS ARTICLE
STOCKS
From Leaders To Laggards
04/15/21 02:14:12 PMby Mark Rivest
Apple and Tesla recent action could signal an approaching bear market.
Position: N/A
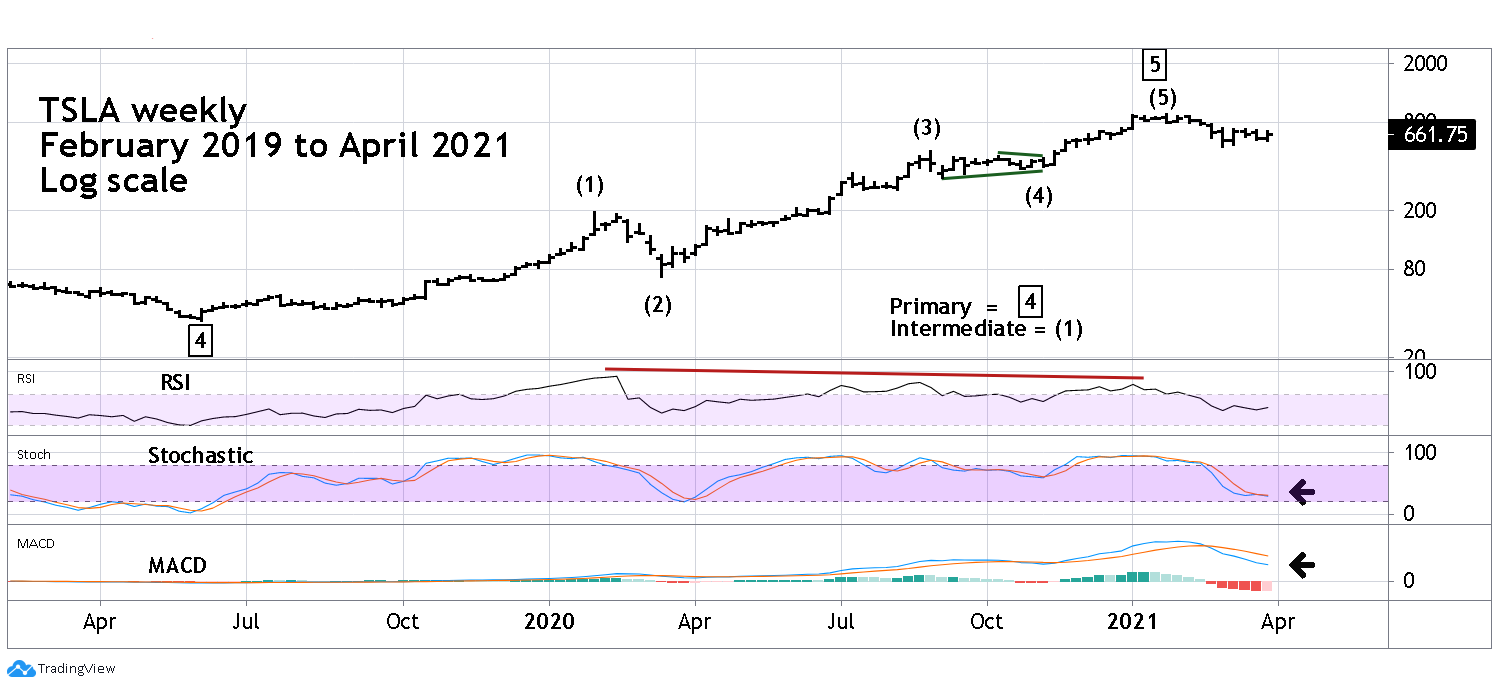
| For decades Apple Inc. (AAPL) has been a powerful leader in the US stock market. Tesla Inc., since the crash bottom in March 2020, has been a mania stock, rising more than 1000% in ten months. Yet since January 2021 both stocks have been trending down while the S&P 500 (SPX) has continued to make new all-time highs. A pause to refresh, or a bearish warning for the broader stock market? Tesla Weekly Please see the weekly Tesla Inc (TSLA) chart illustrated in Figure 1. Since its bottom in June 2019 TSLA appears to have completed an Elliott five-wave impulse pattern. If so, this implies at least a multi-month decline that retraces a significant part of the progress made since June 2019. The two most likely Fibonacci retracement levels are .382 and .618. The double bearish divergence on the weekly RSI supports the Elliott wave count. As of early April 2021, weekly RSI is far from the oversold level. Weekly Stochastic has yet to reach the oversold zone and in February weekly MACD had a bearish crossover. The weight of the weekly momentum evidence suggests TSLA could continue to decline. |
|
| Figure 1. TSLA Weekly. The double bearish divergence on the weekly RSI supports the Elliott wave count. |
| Graphic provided by: TradingView. |
| |
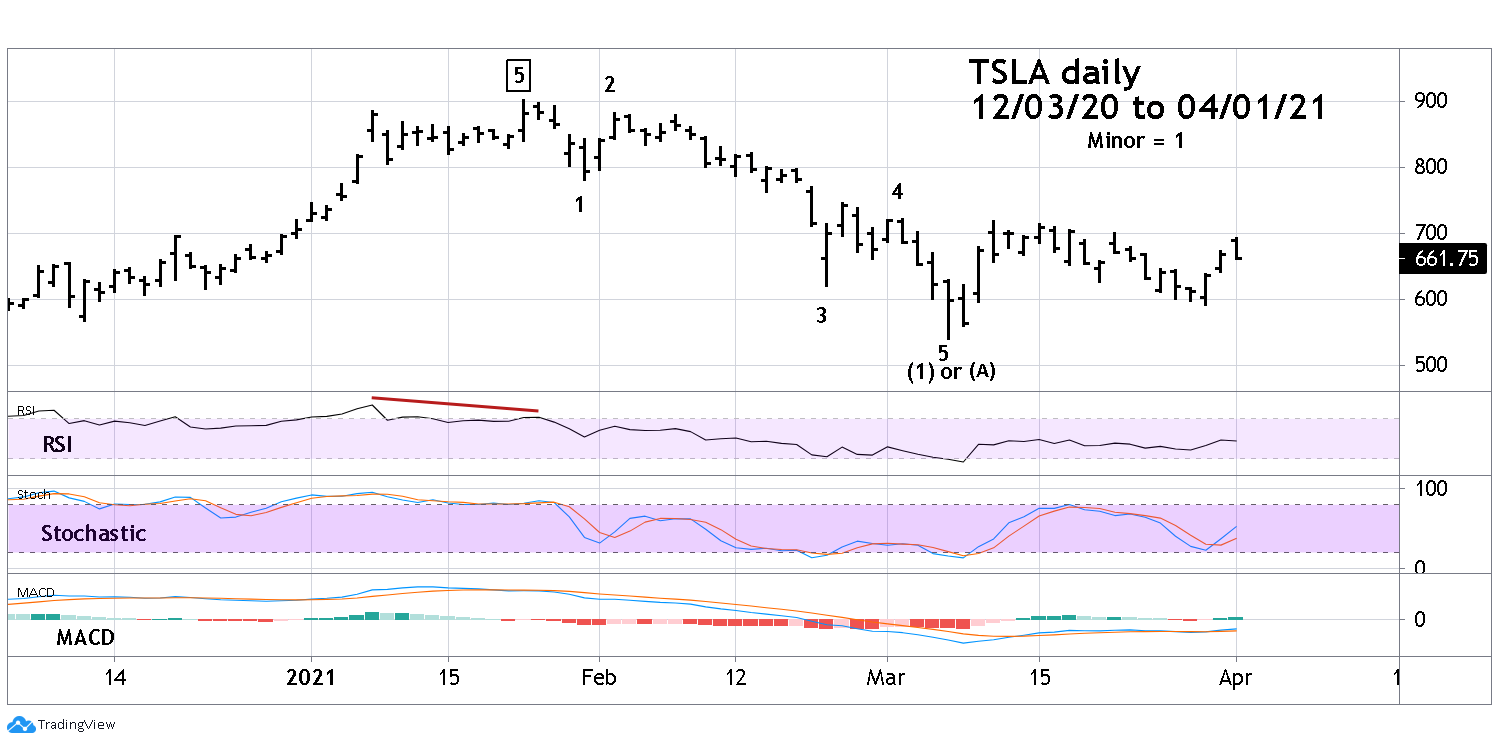
| Tesla Daily Please see the daily TSLA chart illustrated in Figure 2. The daily RSI also has a bearish divergence into TSLA's all-time high. Since the January peak the decline could be the first Elliott wave down of a larger bear move. Note, there's some doubt to this pattern because of the supposed Minor wave "4" shape. The third part of the counter-trend move is below the termination point of the first part. This is referred to as a truncated wave and it opens the door to additional wave counts. |
|
| Figure 2. TSLA Daily. Since the January peak the decline could be the first Elliott wave down of a larger bear move. |
| Graphic provided by: TradingView. |
| |
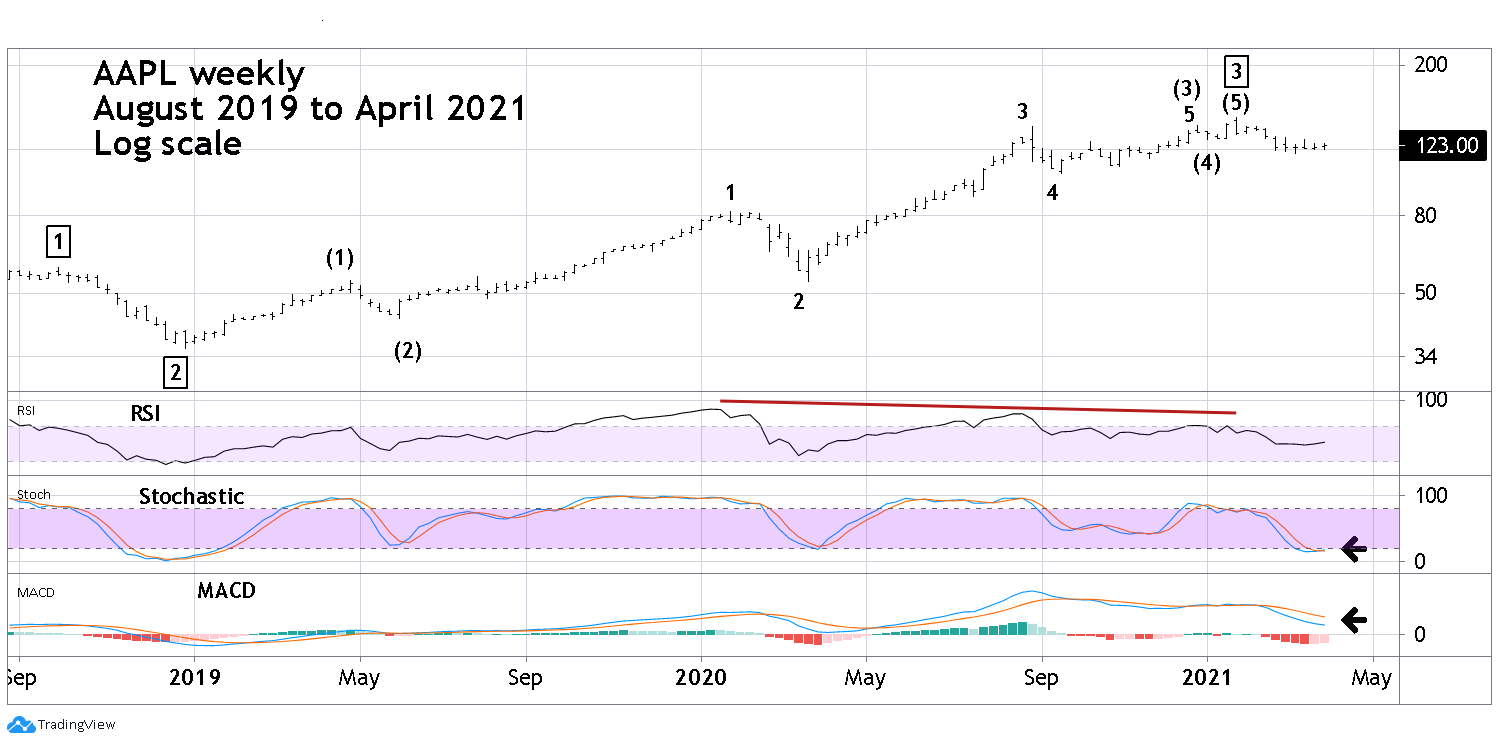
| Apple Weekly Please see the weekly AAPL chart illustrated in Figure 3. From its December 2018 bottom AAPL also appears to have completed an Elliott five-wave impulse pattern. The January 2021 peak is designated Primary wave "3" boxed because the wave action up from December 2018 does not appear to be the fifth wave of a larger multi-year five-wave pattern. If the count illustrated is correct it implies APPL could make a new all-time later in 2021 or 2022. Weekly RSI has a double bearish divergence supporting the Elliott wave count. However, the weekly Stochastic has registered a bullish crossover after marginally reaching the oversold zone. In February weekly MACD had a bearish crossover. The weight of evidence from weekly momentum indicators is bearish. |
|
| Figure 3. AAPL Weekly. In February, weekly MACD had a bearish crossover. |
| Graphic provided by: TradingView. |
| |
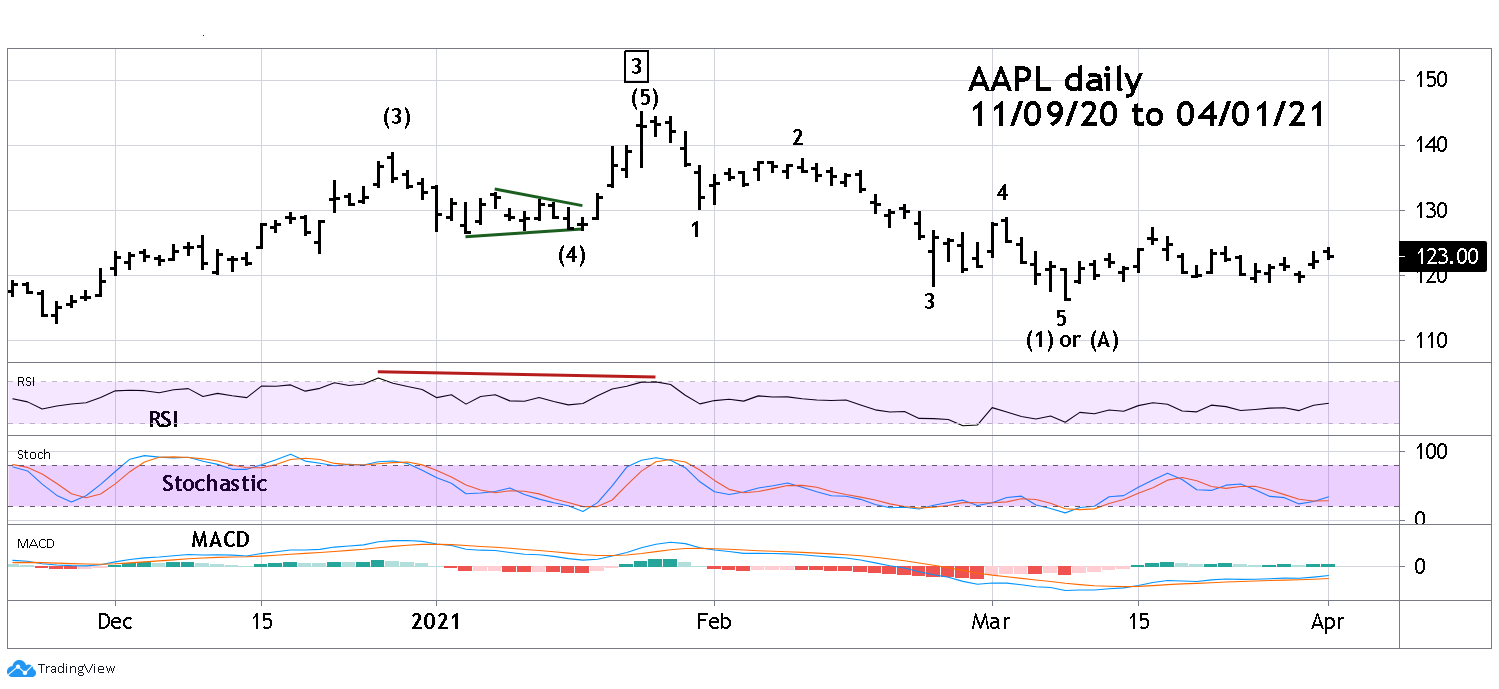
| Apple Daily Please see the daily AAPL chart illustrated in Figure 4. The daily RSI for AAPL, just like TSLA, has a bearish divergence at the all-time high. The decline from the January top is a clear Elliott five-wave impulse pattern. The rally from the March 8 bottom has been anemic and is lagging far behind the SPX. |
|
| Figure 4. AAPL Daily. The decline from the January top is a clear Elliott five�wave impulse pattern. |
| Graphic provided by: TradingView. |
| |
| Summary The long and short-term price patterns and momentum evidence for TSLA and AAPL suggest they both may continue heading lower for at least several weeks. On 04/01/21 the SPX appears to have completed an Elliott wave Ending Diagonal Triangle which was illustrated in my 04/01/21 article "End of the Road?". Additionally, the SPX reached potentially major Fibonacci resistance at 4008. If the SPX is putting in a significant top, TSLA and AAPL could be leaders again. This time leading the way down. Further Reading: Frost A.J and Robert Prechter (1985) "Elliott Wave Principle", New Classics Library. |
Independent investment advisor, trader and writer. He has written articles for Technical Analysis of Stocks & Commodities, Traders.com Advantage,Futuresmag.com and, Finance Magnates. Author of website Four Dimension Trading.
| Website: | www.fourdimensiontrading.com |
| E-mail address: | markrivest@gmail.com |
Click here for more information about our publications!
PRINT THIS ARTICLE

Request Information From Our Sponsors
- StockCharts.com, Inc.
- Candle Patterns
- Candlestick Charting Explained
- Intermarket Technical Analysis
- John Murphy on Chart Analysis
- John Murphy's Chart Pattern Recognition
- John Murphy's Market Message
- MurphyExplainsMarketAnalysis-Intermarket Analysis
- MurphyExplainsMarketAnalysis-Visual Analysis
- StockCharts.com
- Technical Analysis of the Financial Markets
- The Visual Investor
- VectorVest, Inc.
- Executive Premier Workshop
- One-Day Options Course
- OptionsPro
- Retirement Income Workshop
- Sure-Fire Trading Systems (VectorVest, Inc.)
- Trading as a Business Workshop
- VectorVest 7 EOD
- VectorVest 7 RealTime/IntraDay
- VectorVest AutoTester
- VectorVest Educational Services
- VectorVest OnLine
- VectorVest Options Analyzer
- VectorVest ProGraphics v6.0
- VectorVest ProTrader 7
- VectorVest RealTime Derby Tool
- VectorVest Simulator
- VectorVest Variator
- VectorVest Watchdog