

HOT TOPICS LIST
- MACD
- Fibonacci
- RSI
- Gann
- ADXR
- Stochastics
- Volume
- Triangles
- Futures
- Cycles
- Volatility
- ZIGZAG
- MESA
- Retracement
- Aroon
INDICATORS LIST
LIST OF TOPICS
PRINT THIS ARTICLE
by Mark Rivest
Speculative mania and Transportation index imply stocks could be topping.
Position: N/A
Mark Rivest
Independent investment advisor, trader and writer. He has written articles for Technical Analysis of Stocks & Commodities, Traders.com Advantage,Futuresmag.com and, Finance Magnates. Author of website Four Dimension Trading.
PRINT THIS ARTICLE
ELLIOTT WAVE
Entering The End Game - Part Three
02/04/21 02:03:00 PMby Mark Rivest
Speculative mania and Transportation index imply stocks could be topping.
Position: N/A
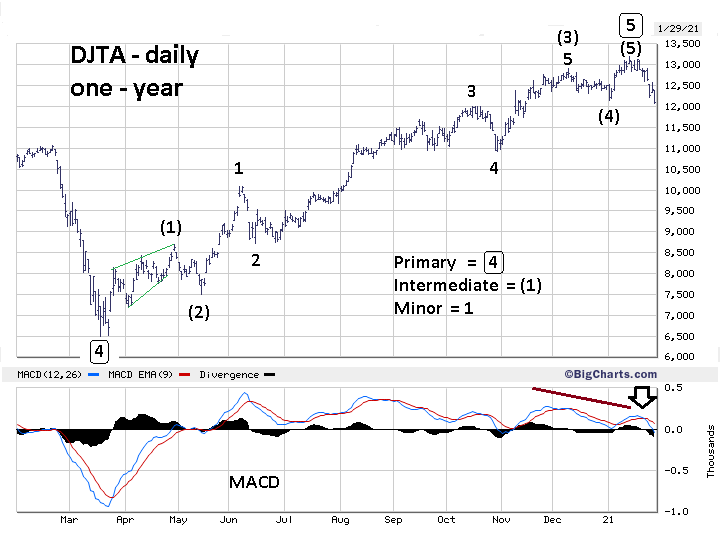
| In late January 2021, several stocks in the US market experienced extraordinary short squeezes. During this time, the Dow Jones Transportation Average (DJI) appears to have completed an Elliott five-wave impulse pattern up from the March 23, 2020 bottom. The combination of these two events hint that at least part of the US stock market may have made a significant top. Dow Jones Transportation Average - Daily Please see the DJTA daily chart illustrated in Figure 1. This is an updated chart that appeared in my November 3, 2020 article " "US Presidential Elections And The Stock Market". Figure 2 of that article had the DJTA October peak labeled an Elliott Minor Wave 3. Momentum evidence indicated the subsequent decline was oversold and concluded "If the DJTA Elliott Wave count from March is correct it implies higher prices throughout the seasonally bullish month of November and perhaps beyond." Prices did rally and the DJTA as of mid-January 2021 appears to have completed an extended Elliott wave impulse pattern from the March 2020 crash bottom. Note the daily MACD had bearish divergences on the lines and histogram. Subsequently lines had a bearish crossover and as of January 29th only one line has broken below zero. If the March 2020 to January 2021 DJTA five-wave pattern is the first wave of a larger developing five-wave pattern, the decline could reach 9,000. This area is near a Fibonacci .618 retrace of the March to January bull move and is the usual retracement zone for wave "two's". However, placing the rally from March 2020 in the context of the bull move from March 2009 implies a much larger decline. |
|
| Figure 1. Note the daily MACD had bearish divergences on the lines and histogram. |
| Graphic provided by: BigCharts.com. |
| |
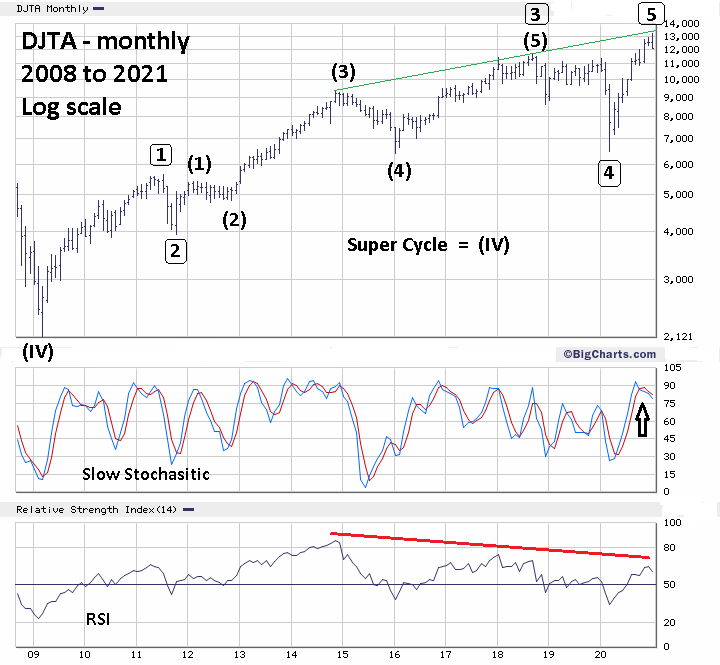
| Dow Jones Transportation Average - Monthly Please see the DJTA monthly chart illustrated in Figure 2. The DJTA from March 2009 shows the same extended five-wave impulse pattern. Note that the recent peak came close to a multi-year rising trendline dating back to 2014. Monthly Slow Stochastic has a bearish crossover in the overbought zone. Monthly RSI has a significant triple bearish divergence, the prior two divergences coming in January and September 2018. The monthly RSI is giving the most bearish signal since the secular bull market began in 2009 and is exactly what to expect after completion of the final fifth wave. If the five waves up from the major bottom in 2009 are the first wave of a larger multi-decade bull market, the next bear market could continue for years and possibly reach 4,000. |
|
| Figure 2. Monthly RSI has a significant triple bearish divergence. |
| Graphic provided by: BigCharts.com. |
| |
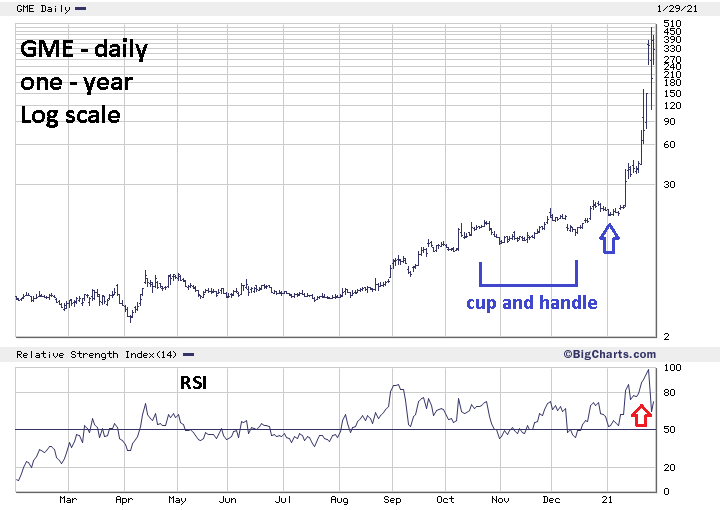
| Speculative Mania History doesn't exactly repeat, it rhymes. The secular bull market climax in 2000 had a speculative mania in Technology initial public offerings. Some stocks doubled in just a few days. In January 2021, the mania is with heavily shorted stocks. Please see the daily chart of GameStop Corporation (GME) illustrated in Figure 3. So far GME has the most powerful short squeeze. The daily RSI for GME has hit an incredible 98%. This level is usually seen at major commodity blowoff tops. This is also a rare instance in which retail speculators are able to overpower hedge fund managers. Successful long side stock speculation requires more than just knowledge of short interest size. Two other factors are needed: a general market uptrend and stock price patterns. A general market bull trend has been in place since March 2020. As for price patterns, GME had two excellent spots in which to initiate long positions. Between October and November 2020 GME formed a "Cup and Handle" formation. This pattern was discovered by William O'Neil. The ideal time to buy is when price breaks above the handle. Note there was another smaller Cup and Handle just above the first. The manic rally in heavy short interest stocks could continue, however after the upward extension is underway it's unlikely other ideal bullish entry points will occur. In the meantime, the mania could draw new players into the game. Like moths to a flame. |
|
| Figure 3. The daily RSI for GME has hit an incredible 98%. |
| Graphic provided by: BigCharts.com. |
| |
| The Topping Process Important stock market bottoms usually happen at one specific time. March 23, 2020 saw a significant bottom for many stocks and stock indices. Important tops are usually spread out. On the first trading day of 2000 Qualcomm Inc., a bull market leader, reached its climax. Two weeks later the Dow Jones Industrial Average reached its bull market peak. In March 2000 the Nasdaq Composite and S&P 500 ended their bull runs. The DJTA could be the first US stock index to complete a bull run that began in March 2009. The anecdotal evidence from the short squeeze mania indicates that US stock market sentiment is near the level reached in late 1999/early 2000. Now is not the time to be plunging into new stock positions. Even if the broader bull market continues for several months, it's time to be cautious. Whenever the next bear trend begins it could be much deeper and last much longer than most are expecting. Further Reading: Frost A.J and Robert Prechter (1985) "Elliott Wave Principle", New Classics Library. O'Neil J. William (2009) "How to Make Money in Stocks", McGraw-Hill |
Independent investment advisor, trader and writer. He has written articles for Technical Analysis of Stocks & Commodities, Traders.com Advantage,Futuresmag.com and, Finance Magnates. Author of website Four Dimension Trading.
| Website: | www.fourdimensiontrading.com |
| E-mail address: | markrivest@gmail.com |
Click here for more information about our publications!
PRINT THIS ARTICLE

Request Information From Our Sponsors
- StockCharts.com, Inc.
- Candle Patterns
- Candlestick Charting Explained
- Intermarket Technical Analysis
- John Murphy on Chart Analysis
- John Murphy's Chart Pattern Recognition
- John Murphy's Market Message
- MurphyExplainsMarketAnalysis-Intermarket Analysis
- MurphyExplainsMarketAnalysis-Visual Analysis
- StockCharts.com
- Technical Analysis of the Financial Markets
- The Visual Investor
- VectorVest, Inc.
- Executive Premier Workshop
- One-Day Options Course
- OptionsPro
- Retirement Income Workshop
- Sure-Fire Trading Systems (VectorVest, Inc.)
- Trading as a Business Workshop
- VectorVest 7 EOD
- VectorVest 7 RealTime/IntraDay
- VectorVest AutoTester
- VectorVest Educational Services
- VectorVest OnLine
- VectorVest Options Analyzer
- VectorVest ProGraphics v6.0
- VectorVest ProTrader 7
- VectorVest RealTime Derby Tool
- VectorVest Simulator
- VectorVest Variator
- VectorVest Watchdog