

HOT TOPICS LIST
- MACD
- Fibonacci
- RSI
- Gann
- ADXR
- Stochastics
- Volume
- Triangles
- Futures
- Cycles
- Volatility
- ZIGZAG
- MESA
- Retracement
- Aroon
INDICATORS LIST
LIST OF TOPICS
PRINT THIS ARTICLE
by Mark Rivest
Bullish clues from the Dow Jones Transportation Average.
Position: N/A
Mark Rivest
Independent investment advisor, trader and writer. He has written articles for Technical Analysis of Stocks & Commodities, Traders.com Advantage,Futuresmag.com and, Finance Magnates. Author of website Four Dimension Trading.
PRINT THIS ARTICLE
MOMENTUM
US Presidential Elections And The Stock Market
11/03/20 02:34:13 PMby Mark Rivest
Bullish clues from the Dow Jones Transportation Average.
Position: N/A
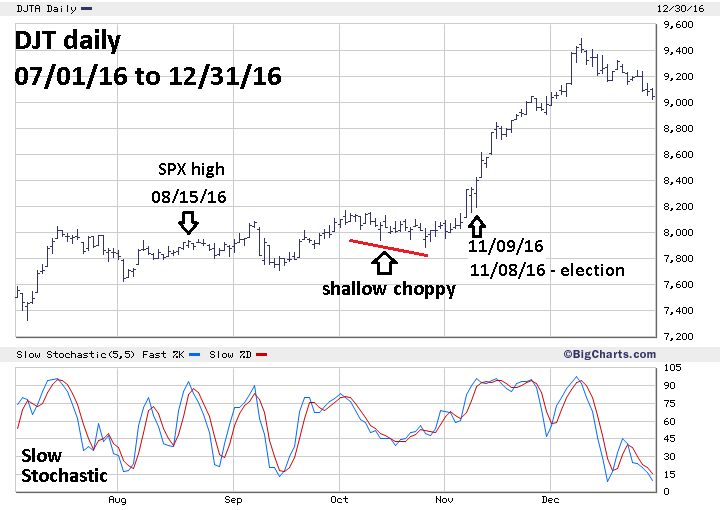
| US Presidential elections cause anxiety; most market analysts will focus on who could win the election to determine which direction the stock market could take. The correct approach is to focus on what signals the stock market is giving to determine what direction the stock market could take. Prior to the 2016 US Presidential election the Dow Jones Transportation Average (DJT) was giving bullish signals. Prior to the 2020 election the DJT is again giving bullish signals. Dow Jones Transportation Average In 2016 Please see the 2016 daily DJT chart (symbol DJTA on Bigcharts.com) illustrated in Figure 1. My 11/8/16 article "Too Close to Call" noted the bullish price pattern of the DJT stating in the article, "If the broader stock market is in a bear market, then someone forgot to send this index an invitation." The first bullish clue came in September 2016 when the DJT made a new high for the rally that began in early 2016, while the S&P 500 (SPX) failed to exceed its rally top made on August 15. The second bullish clue came in early October off of another new rally high. The subsequent decline during the seasonally bearish month was very shallow and choppy — the signature of a correction within a bull market. These two signals implied the DJT could continue to rally into the seasonally bullish month of November. |
|
| Figure 1. The decline during the seasonally bearish month was very shallow and choppy. |
| Graphic provided by: BigCharts.com. |
| |
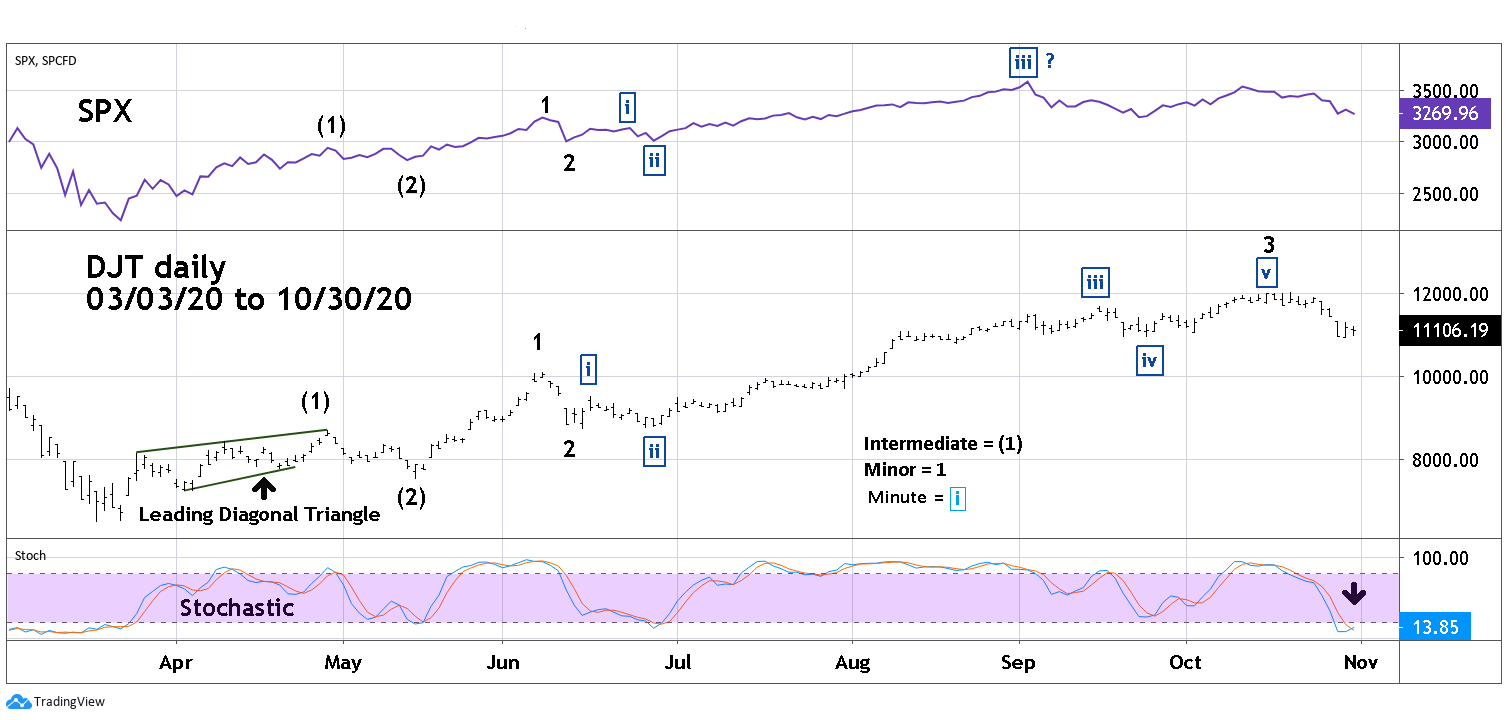
| Dow Jones Transportation Average In 2020 Please see the daily DJT and SPX chart illustrated in Figure 2. In late 2020, just like in 2016, the DJT is stronger than the SPX. Prior to October the DJT was slightly lagging the SPX in the rally from March 23. The SPX exceeded its early 2020 high on August 19 while the DJT did not exceed its 2020 top until September 2. Subsequently, DJT continued to make new 2020 highs unaccompanied by the SPX. DJT made its 2020 peak on October 20 while the SPX could only rally until October 12 which was below its primary peak made on September 2. The second bullish clue comes from the DJT daily Stochastic which had a bullish crossover in the oversold zone. The third Bullish clue comes from the DJT Elliott Wave count. In terms of proportionality the DJT has the clearest Elliott Wave pattern of all the US stock indices since the March bottom. The SPX Elliott Wave count illustrated is one of several alternate counts. The difficulty in determining the best Elliott count comes from the September decline which is larger in size than the supposed higher degree declines that occurred in May and June. While this is not a rule violation, it does open the door for several other possible wave counts. If the DJT Elliott Wave count from March is correct it implies higher prices throughout the seasonally bullish month of November and perhaps beyond. |
|
| Figure 2. If the DJT Elliott Wave count from March is correct it implies higher prices throughout the seasonally bullish month of November and perhaps beyond. |
| Graphic provided by: TradingView. |
| |
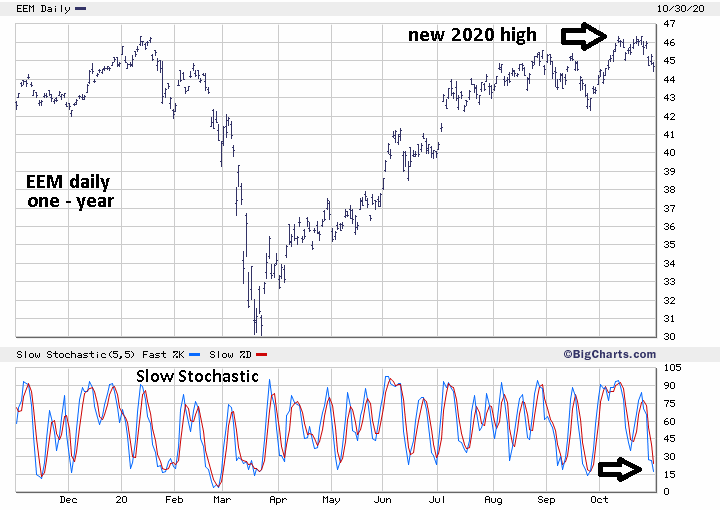
| Emerging Markets Fund Supplemental bullish evidence comes from the iShares MSCI Emerging Markets Exchange Traded Fund (EEM). Please see the daily EEM chart illustrated in Figure 3. For clarity only one year of this fund's history is being shown; longer term charts illustrate how weak this fund is relative to the broader stock market. EEM's 2020 high is 46.34, while the high for its bull market from the major bottom made in 2008 came in January 2018 at 52.08. EEM's all-time high was made in October 2007 at 55.83. While most US stock and other national indices are trading above their 2007 market peaks, EEM lags significantly behind. In late 2020 something different is happening. On October 12 EEM exceeded its early 2020 high, while the SPX failed to exceed its 2020 peak. Subsequently EEM traded sideways similar to the DJT and did not decline until October 23. The drop into the low made on October 30 was only 4% vs. a greater than 8% SPX decline from October 12 to 30. The daily Slow Stochastic on October 30 was near oversold, implying a bottom could come soon — if not already in place. Why is one of the weakest stock funds now showing strength vs. the broader market? |
|
| Figure 3. The daily Slow Stochastic on October 30 was near oversold, implying a bottom could come soon, if not already in place. |
| Graphic provided by: BigCharts.com. |
| |
| Anomalies Watch for something different, when a stock or index is acting contrary to what you would expect vs. the broader market. It could be an important clue to the overall market direction. In 2016 when the relatively weak DJT began showing strength vs. the SPX it was a bullish clue. In late 2020 the DJT and EEM are suddenly stronger than the SPX — again a bullish clue. When forecasting the direction of any market you need to focus on the signals from the market, especially the anomalies. Yes, whoever is elected US President will have an effect on the economy and ultimately the stock market. These effects take time, and the President of the US is just one of many factors influencing the economy. Ultimately, the President could cause a market to change direction. Prior to the change, the market could signal the coming turn. Focus on market behavior, not headlines. Further Reading: Frost A.J and Robert Prechter (1985) "Elliott Wave Principle", New Classics Library. |
Independent investment advisor, trader and writer. He has written articles for Technical Analysis of Stocks & Commodities, Traders.com Advantage,Futuresmag.com and, Finance Magnates. Author of website Four Dimension Trading.
| Website: | www.fourdimensiontrading.com |
| E-mail address: | markrivest@gmail.com |
Click here for more information about our publications!
PRINT THIS ARTICLE

Request Information From Our Sponsors
- StockCharts.com, Inc.
- Candle Patterns
- Candlestick Charting Explained
- Intermarket Technical Analysis
- John Murphy on Chart Analysis
- John Murphy's Chart Pattern Recognition
- John Murphy's Market Message
- MurphyExplainsMarketAnalysis-Intermarket Analysis
- MurphyExplainsMarketAnalysis-Visual Analysis
- StockCharts.com
- Technical Analysis of the Financial Markets
- The Visual Investor
- VectorVest, Inc.
- Executive Premier Workshop
- One-Day Options Course
- OptionsPro
- Retirement Income Workshop
- Sure-Fire Trading Systems (VectorVest, Inc.)
- Trading as a Business Workshop
- VectorVest 7 EOD
- VectorVest 7 RealTime/IntraDay
- VectorVest AutoTester
- VectorVest Educational Services
- VectorVest OnLine
- VectorVest Options Analyzer
- VectorVest ProGraphics v6.0
- VectorVest ProTrader 7
- VectorVest RealTime Derby Tool
- VectorVest Simulator
- VectorVest Variator
- VectorVest Watchdog