HOT TOPICS LIST
- MACD
- Fibonacci
- RSI
- Gann
- ADXR
- Stochastics
- Volume
- Triangles
- Futures
- Cycles
- Volatility
- ZIGZAG
- MESA
- Retracement
- Aroon
INDICATORS LIST
LIST OF TOPICS
PRINT THIS ARTICLE
by Matt Blackman
Scottish poet, Robbie Burns once said, "the best laid plans of mice and men come oft t'glay." It is something traders can never forget. As we see from my last alert on Nortel, it is imperative to have a 'plan B' close at hand and when conditions change, so should your plan.
Position: N/A
Matt Blackman
Matt Blackman is a full-time technical and financial writer and trader. He produces corporate and financial newsletters, and assists clients in getting published in the mainstream media. He is the host of TradeSystemGuru.com. Matt has earned the Chartered Market Technician (CMT) designation. Find out what stocks and futures Matt is watching on Twitter at www.twitter.com/RatioTrade
PRINT THIS ARTICLE
STRATEGIES
Nortel on the Move All Right!
01/10/03 01:46:14 PMby Matt Blackman
Scottish poet, Robbie Burns once said, "the best laid plans of mice and men come oft t'glay." It is something traders can never forget. As we see from my last alert on Nortel, it is imperative to have a 'plan B' close at hand and when conditions change, so should your plan.
Position: N/A
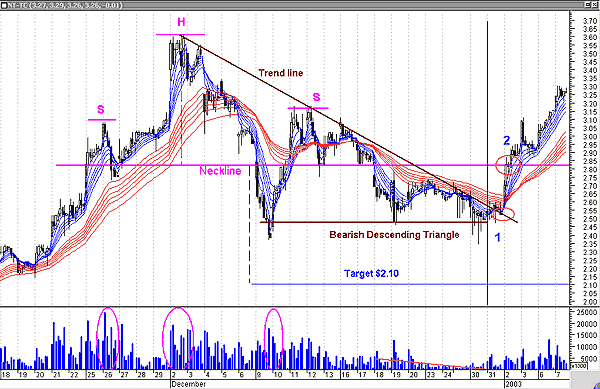
| The article entitled "Nortel in a Trend - But Will It Hold?" (01/06/03) showed Nortel (NT-TSX) in a downtrend that could have been acted on by aggressive short traders (Figure 1). Demonstrating a classic head & shoulders top pattern using 60-minute data and where to sell as of December 30, 2002, it looked like a sure thing. |
| But then something dramatic happened that clearly illustrated why stop-losses, an alternate plan and target entry/exit prices are so important. It also teaches traders the value of using different time frames in the analysis process. |

|
| Figure 1 – Nortel Networks (NT-TSX 60-minute) in Canadian dollars showing a dramatic change in direction on January 2, 2003. Overlaid on the chart are Daryl Guppy’s exponential moving averages (EMAs) consisting of 3, 5, 8, 12, and 15-period (blue) and 30, 25, 40, 45, 50 and 60 (red) lines. The chart for the original article was constructed on December 30. |
| Graphic provided by: MetaStock. |
| |
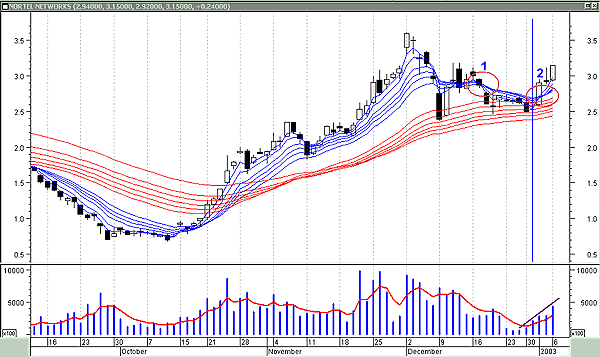
| Although the stock is too cheap to short, a short position could have been entered as suggested by the Guppy system as the 3-period crossed the 8-period EMA moving downward (just before point 1) on December 31, 2002. Instead, the stock shot up on relatively light volume, moving from $2.50CAD to $3.25 on January 7, 2003. A look at the daily chart shows a very different picture (Figure 2). |
 Figure 2 - Nortel Networks (NT-TSX) showing first and second short-term EMA crossovers. Point 1 is a warning that the trend may be changing, point 2 that the trend is changing back and the medium-term trend as denoted by the longer-term EMAs (red lines) is confirmed. |
| The moral of the story, as any experienced trader will tell you, is that a plan that looks infallible on paper can and often does change direction in dramatic fashion. For this reason, the following steps are crucial: It also shows that risk is an important part of trading. Those who manage it best will triumph, assuming the rest of their plan works. So where is Nortel going from here? A price of $3.50CAD would be understandable if the company earned around $0.15 per share, which implies a price/earnings ratio of around 30. The only problem is that the company is still at least two years away from earning a profit, if you believe the estimates. Can you say 'irrational exuberance?' |
Matt Blackman is a full-time technical and financial writer and trader. He produces corporate and financial newsletters, and assists clients in getting published in the mainstream media. He is the host of TradeSystemGuru.com. Matt has earned the Chartered Market Technician (CMT) designation. Find out what stocks and futures Matt is watching on Twitter at www.twitter.com/RatioTrade
| Company: | TradeSystemGuru.com |
| Address: | Box 2589 |
| Garibaldi Highlands, BC Canada | |
| Phone # for sales: | 604-898-9069 |
| Fax: | 604-898-9069 |
| Website: | www.tradesystemguru.com |
| E-mail address: | indextradermb@gmail.com |
Traders' Resource Links | |
| TradeSystemGuru.com has not added any product or service information to TRADERS' RESOURCE. | |
Click here for more information about our publications!
Comments
Date: 01/15/03Rank: 5Comment:

|

Request Information From Our Sponsors
- StockCharts.com, Inc.
- Candle Patterns
- Candlestick Charting Explained
- Intermarket Technical Analysis
- John Murphy on Chart Analysis
- John Murphy's Chart Pattern Recognition
- John Murphy's Market Message
- MurphyExplainsMarketAnalysis-Intermarket Analysis
- MurphyExplainsMarketAnalysis-Visual Analysis
- StockCharts.com
- Technical Analysis of the Financial Markets
- The Visual Investor
- VectorVest, Inc.
- Executive Premier Workshop
- One-Day Options Course
- OptionsPro
- Retirement Income Workshop
- Sure-Fire Trading Systems (VectorVest, Inc.)
- Trading as a Business Workshop
- VectorVest 7 EOD
- VectorVest 7 RealTime/IntraDay
- VectorVest AutoTester
- VectorVest Educational Services
- VectorVest OnLine
- VectorVest Options Analyzer
- VectorVest ProGraphics v6.0
- VectorVest ProTrader 7
- VectorVest RealTime Derby Tool
- VectorVest Simulator
- VectorVest Variator
- VectorVest Watchdog
