HOT TOPICS LIST
- MACD
- Fibonacci
- RSI
- Gann
- ADXR
- Stochastics
- Volume
- Triangles
- Futures
- Cycles
- Volatility
- ZIGZAG
- MESA
- Retracement
- Aroon
INDICATORS LIST
LIST OF TOPICS
PRINT THIS ARTICLE
by Matt Blackman
Nortel (NT-NYSE and NT-TSX) is anything but dull. And now it appears to be headed lower. Is this a predictable trend or will it fool investors again?
Position: N/A
Matt Blackman
Matt Blackman is a full-time technical and financial writer and trader. He produces corporate and financial newsletters, and assists clients in getting published in the mainstream media. He is the host of TradeSystemGuru.com. Matt has earned the Chartered Market Technician (CMT) designation. Find out what stocks and futures Matt is watching on Twitter at www.twitter.com/RatioTrade
PRINT THIS ARTICLE
MOVING AVERAGES
Nortel in a Trend - But Will It Hold?
01/06/03 02:18:24 PMby Matt Blackman
Nortel (NT-NYSE and NT-TSX) is anything but dull. And now it appears to be headed lower. Is this a predictable trend or will it fool investors again?
Position: N/A
| Everyone loves to play Nortel roulette. It's like taking a trip to Vegas each time you place a buy (or sell) order. |
| Shorts loved it while it plummeted from a high of $123 CAD ($80 US) in July 2000 to a low of $0.69CAD in October 2002. Then it was the turn of long investors who rode it back up to $3.60CAD in early December. But since then, the shorts have come back en masse and the stock is headed back south again. Is the recent turnaround a cruel ruse, or is it here to stay? |

|
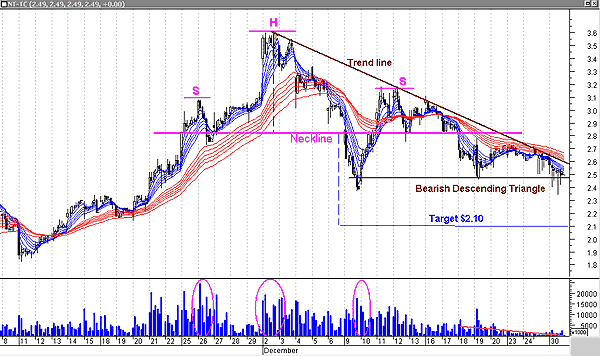
| Figure 1 – Nortel (NT-TSX) 60-minute November-December 2002 chart showing Daryl Guppy’s exponential multiple moving averages to trade the trend. MetaStock provides a Guppy template that displays the EMAs as shown above. |
| Graphic provided by: MetaStock. |
| |
| Daryl Guppy has a system to help traders and investors answer this question. Consisting of a series of exponential moving averages, short-term (blue) lines are 3, 5, 8, 10, 12 and 15-periods. The longer-term (red) averages are 30, 25, 40, 45, 50 and 60-periods. As Daryl explains it, the blue lines represent the short-term traders and the red, the long-term investors. A trend is established when the red lines are far apart and strongest at maximum separation. |
| Entry trades are placed when the blue lines crossover (maximum agreement) and then cross back again (back towards maximum disagreement). As long as the width between the red lines remains significant, the trend is said to be in place. Trades are exited after maximum disagreement has been reached and then a move towards maximum agreement occurs i.e. the red and blue lines are farthest apart and then merge as the blue lines cross the red. An example of this can be seen from December 4 to 12 (following the formation of the head). Looking at Figure 1, a long trade would have been recommended on November 21, 2002 after the blue lines crossed (price moved down) and crossed back again (as the price moved higher). You will note that the width between the red lines widened thereby identifying a strengthening trend. Another long position would have been advisable on November 26 (just after top of left shoulder) when the process repeated itself but again the red lines maintained their depth. Long trades would have been exited in early December as the blue lines crossed over themselves and then penetrated the red MAs. |
| So according to the Guppy model, the trend heading into the New Year was definitely down. This was supported by a rather rough head & shoulders top pattern suggesting a downside target of $2.10 as well as a bearish descending triangle chart pattern. Next time the stock rallies, Guppy followers will be getting set to take a short position assuming that the 30-period MA is not crossed and the shorter term lines cross back in the desired direction. One caveat, the stock dropped through December on relatively light volume. Ideally, it is desirable to see substantial volume when the stock moves down through the neckline, which did not happen. Shorts are advised to watch volume very closely in case this baby changes its mind - again! |
Matt Blackman is a full-time technical and financial writer and trader. He produces corporate and financial newsletters, and assists clients in getting published in the mainstream media. He is the host of TradeSystemGuru.com. Matt has earned the Chartered Market Technician (CMT) designation. Find out what stocks and futures Matt is watching on Twitter at www.twitter.com/RatioTrade
| Company: | TradeSystemGuru.com |
| Address: | Box 2589 |
| Garibaldi Highlands, BC Canada | |
| Phone # for sales: | 604-898-9069 |
| Fax: | 604-898-9069 |
| Website: | www.tradesystemguru.com |
| E-mail address: | indextradermb@gmail.com |
Traders' Resource Links | |
| TradeSystemGuru.com has not added any product or service information to TRADERS' RESOURCE. | |
Click here for more information about our publications!
Comments
Date: 01/06/03Rank: 4Comment:
Date: 01/07/03Rank: 5Comment:

Request Information From Our Sponsors
- StockCharts.com, Inc.
- Candle Patterns
- Candlestick Charting Explained
- Intermarket Technical Analysis
- John Murphy on Chart Analysis
- John Murphy's Chart Pattern Recognition
- John Murphy's Market Message
- MurphyExplainsMarketAnalysis-Intermarket Analysis
- MurphyExplainsMarketAnalysis-Visual Analysis
- StockCharts.com
- Technical Analysis of the Financial Markets
- The Visual Investor
- VectorVest, Inc.
- Executive Premier Workshop
- One-Day Options Course
- OptionsPro
- Retirement Income Workshop
- Sure-Fire Trading Systems (VectorVest, Inc.)
- Trading as a Business Workshop
- VectorVest 7 EOD
- VectorVest 7 RealTime/IntraDay
- VectorVest AutoTester
- VectorVest Educational Services
- VectorVest OnLine
- VectorVest Options Analyzer
- VectorVest ProGraphics v6.0
- VectorVest ProTrader 7
- VectorVest RealTime Derby Tool
- VectorVest Simulator
- VectorVest Variator
- VectorVest Watchdog
