

HOT TOPICS LIST
- MACD
- Fibonacci
- RSI
- Gann
- ADXR
- Stochastics
- Volume
- Triangles
- Futures
- Cycles
- Volatility
- ZIGZAG
- MESA
- Retracement
- Aroon
INDICATORS LIST
LIST OF TOPICS
PRINT THIS ARTICLE
by Mark Rivest
See why December 2020 could be a good time to buy precious metals.
Position: N/A
Mark Rivest
Independent investment advisor, trader and writer. He has written articles for Technical Analysis of Stocks & Commodities, Traders.com Advantage,Futuresmag.com and, Finance Magnates. Author of website Four Dimension Trading.
PRINT THIS ARTICLE
SEASONAL TRADING
Gold And Silver Seasonal Bottoms
12/17/20 02:59:43 PMby Mark Rivest
See why December 2020 could be a good time to buy precious metals.
Position: N/A
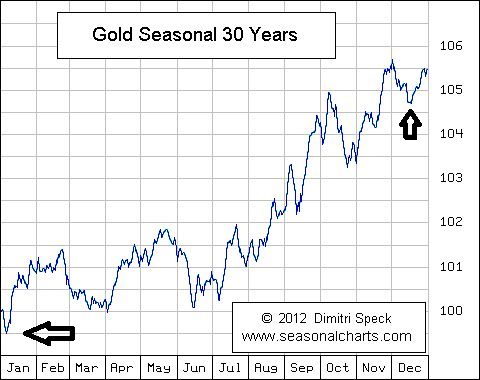
| Both Gold and Silver have seasonal lows in December followed by multi-month rallies. Generally, Gold can rise into at least February, while Silver's bull moves can sometimes continue into April. The actions of Gold in late 2020 could reveal an excellent price area to begin buying precious metals. Gold Seasonal Pattern Please see the seasonal Gold chart illustrated in Figure 1. This chart is derived from thirty years of data up to 2012. This may appear to be dated, however seasonal patterns are broad and don't vary much even over a period of several years. This chart shows two possible times to initiate Gold long positions: mid-December and early January. From those entry points traders with a multi-week time frame could possibly hold until late February. What about long-term investors holding positions for several years? Gold is seasonally bearish from February until early April. If the December to February rally was a counter-trend move in a larger bear market, it's possible the move down into April could break the December bottom. When using seasonal charts, they need to be placed in the proper context of larger multi-year price patterns. |
|
| Figure 1. This chart shows two possible times to initiate Gold long positions: mid-December and early January. |
| Graphic provided by: Dimitri Speck - seasonalcharts.com. |
| |
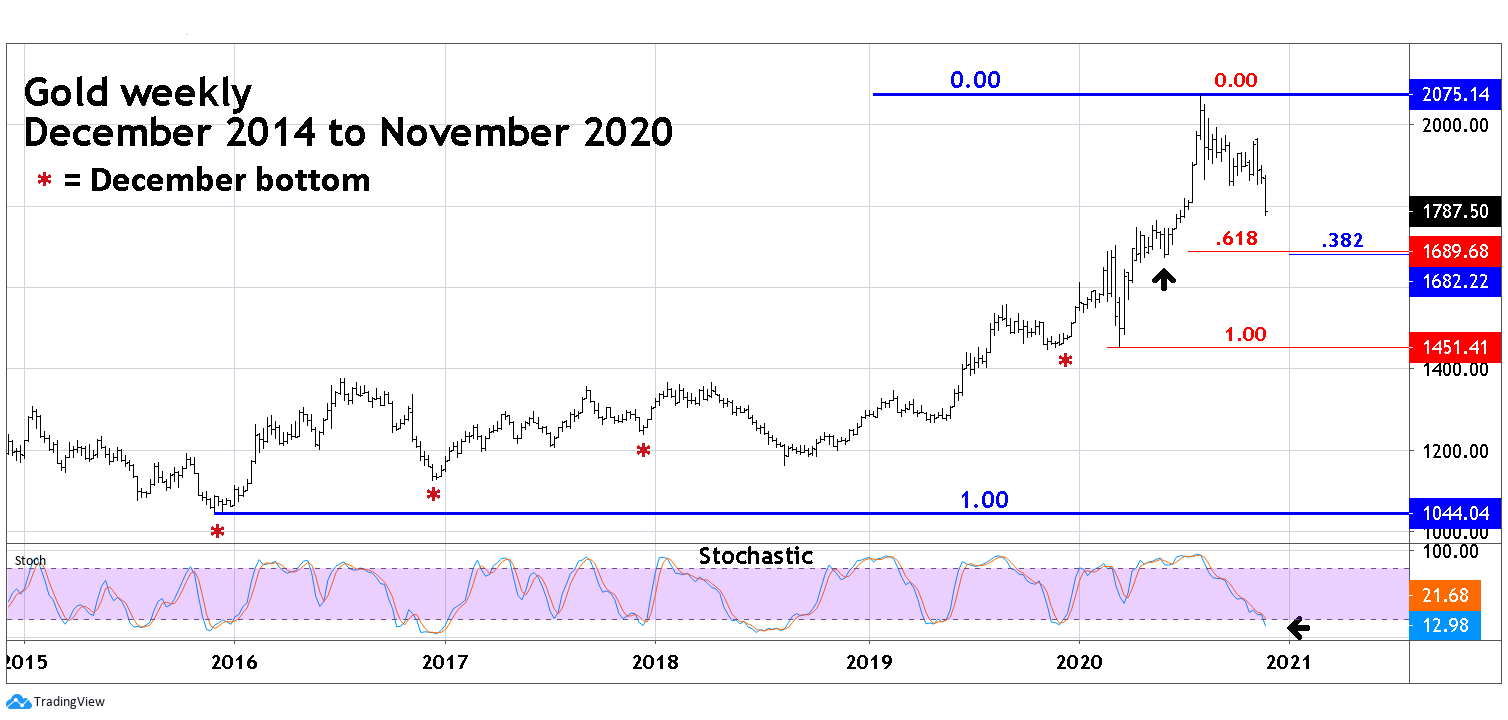
| Gold - Weekly Please see the weekly Gold in US dollars chart illustrated in Figure 2. The seasonal chart in Figure 1 used data up to 2012; note that seasonal December bottoms were made in four out of the last five years. My August 27 article "Precious Metals Rally" illustrated an Elliott Wave count for Gold up to its peak in August 2020. The size of the subsequent decline has made that wave count less reliable and it could soon be invalidated. As of late November 2020, there are several alternate wave counts — none of which has a high probability. Lack of a clear Elliott Wave count is not a deterrent to discovering trade entry points. Two Fibonacci coordinates close together could be a powerful support area. Fibonacci retrace/extension points act like magnets and resisters to market movements. The greater the number of Fibonacci points and their proximity increase the power of the magnet/resister. A .382 retrace of the bull market from 2015 to 2020 is at 1682.22. A .618 retrace of the March to August 2020 bull move comes to 1689.68, extremely close to the first coordinate. Additionally, these points are in the area of the June 2020 correction. This triple layer of support could be a formidable barrier for declining price. The weekly Stochastics has reached the oversold zone, implying a bottom could come soon if not already in place as of late November. |
|
| Figure 2. Two Fibonacci coordinates close together could be a powerful support area. |
| Graphic provided by: TradingView. |
| |
| Strategy There are four dimensions in market analysis: Price, Time, Sentiment, and Momentum. December is a high probability of being the time to go long Gold and Silver. Fibonacci coordinates and chart support illustrate the price zone where a bottom could form. Weekly Stochastic is oversold implying downward momentum is waning. So far as of late November 2020 there are no strong sentiment readings — this could quickly change. Evidence from three of the four market dimensions suggest a buying opportunity for Gold could come soon. Silver closely follows Gold and could also be presenting a buying opportunity. It's possible Gold bottomed in late November, however two Fibonacci coordinates in proximity to a chart support could be a powerful magnet dragging price towards that level. If Gold can reach the 1680 area sometime mid to late December 2020 it could provide an opportunity for take advantage of an early 2021 rally. |
Independent investment advisor, trader and writer. He has written articles for Technical Analysis of Stocks & Commodities, Traders.com Advantage,Futuresmag.com and, Finance Magnates. Author of website Four Dimension Trading.
| Website: | www.fourdimensiontrading.com |
| E-mail address: | markrivest@gmail.com |
Click here for more information about our publications!
PRINT THIS ARTICLE

Request Information From Our Sponsors
- StockCharts.com, Inc.
- Candle Patterns
- Candlestick Charting Explained
- Intermarket Technical Analysis
- John Murphy on Chart Analysis
- John Murphy's Chart Pattern Recognition
- John Murphy's Market Message
- MurphyExplainsMarketAnalysis-Intermarket Analysis
- MurphyExplainsMarketAnalysis-Visual Analysis
- StockCharts.com
- Technical Analysis of the Financial Markets
- The Visual Investor
- VectorVest, Inc.
- Executive Premier Workshop
- One-Day Options Course
- OptionsPro
- Retirement Income Workshop
- Sure-Fire Trading Systems (VectorVest, Inc.)
- Trading as a Business Workshop
- VectorVest 7 EOD
- VectorVest 7 RealTime/IntraDay
- VectorVest AutoTester
- VectorVest Educational Services
- VectorVest OnLine
- VectorVest Options Analyzer
- VectorVest ProGraphics v6.0
- VectorVest ProTrader 7
- VectorVest RealTime Derby Tool
- VectorVest Simulator
- VectorVest Variator
- VectorVest Watchdog