

HOT TOPICS LIST
- MACD
- Fibonacci
- RSI
- Gann
- ADXR
- Stochastics
- Volume
- Triangles
- Futures
- Cycles
- Volatility
- ZIGZAG
- MESA
- Retracement
- Aroon
INDICATORS LIST
LIST OF TOPICS
PRINT THIS ARTICLE
by Mark Rivest
Are the strong moves up in Gold and Silver long-term bull markets?
Position: Buy
Mark Rivest
Independent investment advisor, trader and writer. He has written articles for Technical Analysis of Stocks & Commodities, Traders.com Advantage,Futuresmag.com and, Finance Magnates. Author of website Four Dimension Trading.
PRINT THIS ARTICLE
ELLIOTT WAVE
Precious Metals Rally
08/27/20 05:23:49 PMby Mark Rivest
Are the strong moves up in Gold and Silver long-term bull markets?
Position: Buy
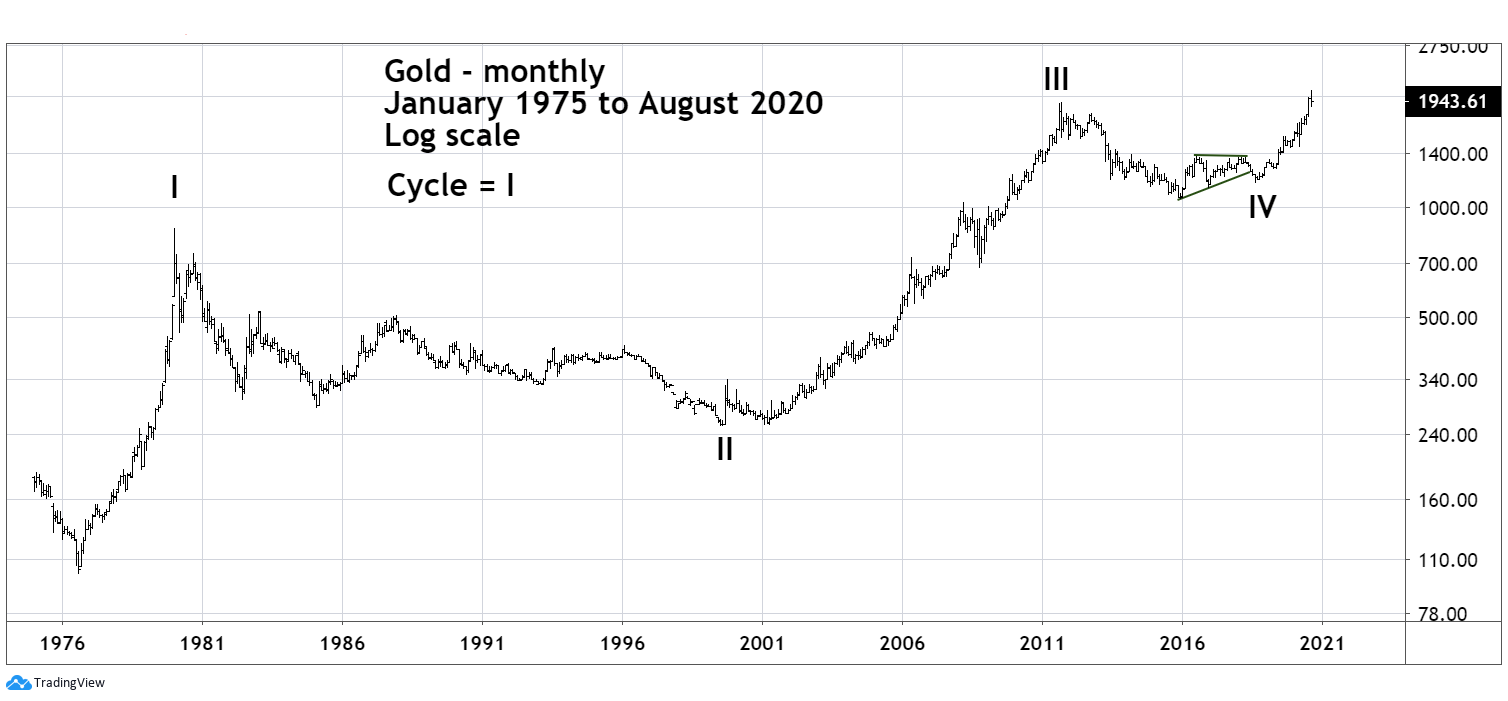
| In March 2020 Silver made a new low in a multi-year bear market while Gold declined 14% in just five trading days. These moves, particularly Silver making a new bear market low, appeared to be the beginning of a multi-month bear phase. These bottoms turned out to be the starting points of very sharp rallies. Elliott Wave theory provides clues to the near-term direction and possible long-term view of these markets. Gold - Big Picture Please see the Gold monthly chart illustrated in Figure 1. In the mid 1970's limitations on Gold ownership in the US were repealed. At the time the US was experiencing strong inflation which culminated in the early 1980's. Gold correspondingly had an immensely powerful bull market that climaxed in January 1980. The next nineteen years were a bad time for Gold bugs, having to deal with a multi-decade bear market. Note what happened at the bottom of the bear market — labeled Cycle wave II. A very sharp rally which turned out to be the kickoff of a multi-year bull market. For Gold bull's, happiness was short-lived as they had to endure another bear phase that lasted more than one year, terminating just above the bear market bottom made in August 1999. This bear to bull transition could provide an important clue to what may happened in the next several months. The Gold bull market from February 2001 continued until September 2011. Afterwards there was another multi-year bear market. Note that from an Elliott Wave perspective this bear market did not end at the nadir of price in December 2015, but at the higher bottom made in 2018 — labeled as Cycle wave IV. The structure from September 2011 to August 2018 appears to be an Elliott Wave Horizontal Triangle. These are sideways corrective patterns that have five sub-waves, each of which sub-divide into three wave patterns. The initial rally from January 2015 to July 2016 was a clear three wave pattern leading most practitioners of Elliott theory to suspect it was a rally within an ongoing bear market. Gold's move above the September 2011 peak implies it could be in the fifth wave of a multi-decade bull market. If so, the recent rally could be the kickoff phase of a bull market continuing for years. |
|
| Figure 1. Gold's move above the September 2011 peak implies it could be in the fifth wave of a multi-decade bull market. |
| Graphic provided by: TradingView. |
| |
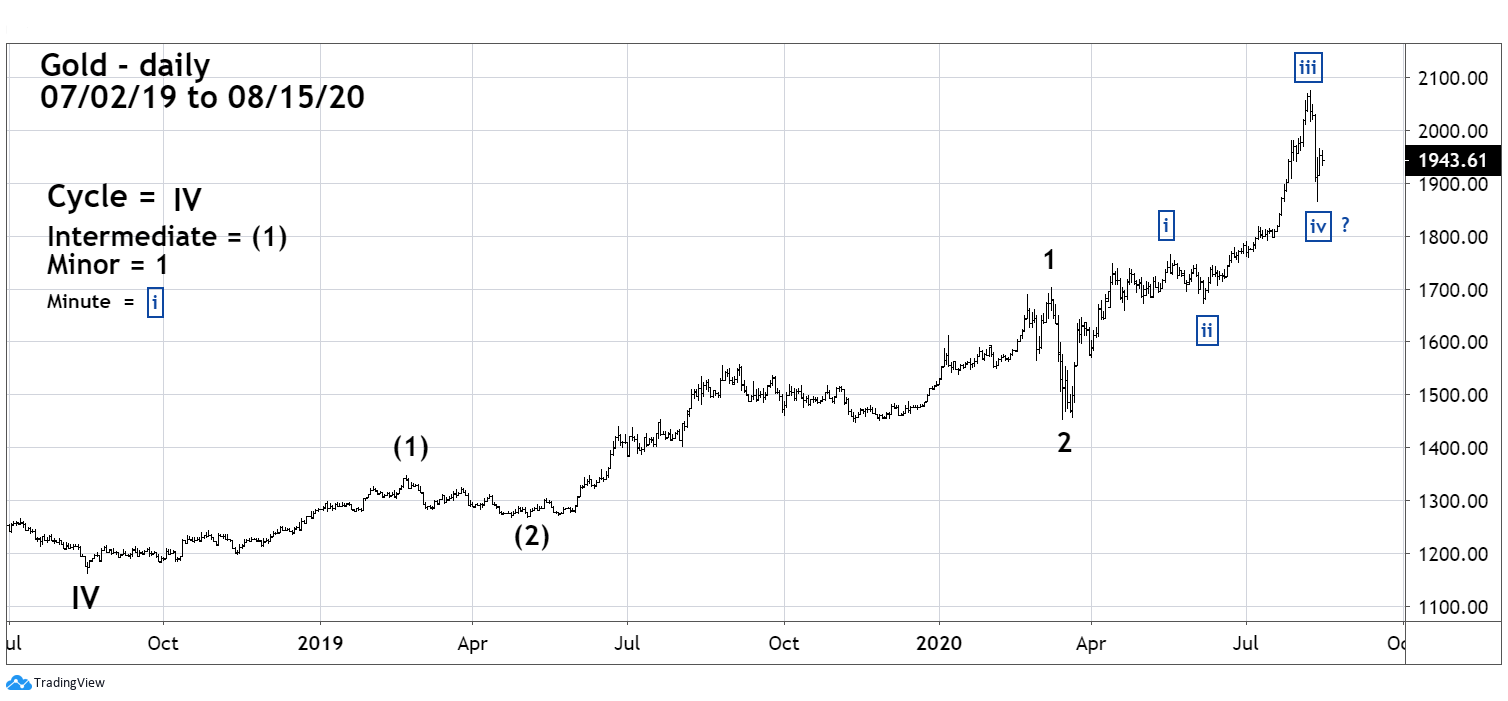
| Gold - Short-Term Please see the Gold daily chart illustrated in Figure 2. Gold appears to be in the middle of a developing Elliott five wave pattern that began in August 2018 — labeled Cycle wave IV. If so, it implies a rally that could continue for several months and that declines should be viewed as opportunities to buy. If Gold were to break below the bottom made on June 8th at 1670.88, labeled Minute wave "ii" boxed, it would invalidate the bullish wave count. |
|
| Figure 2. Gold appears to be in the middle of a developing Elliott five wave pattern that began in August 2018. |
| Graphic provided by: TradingView. |
| |
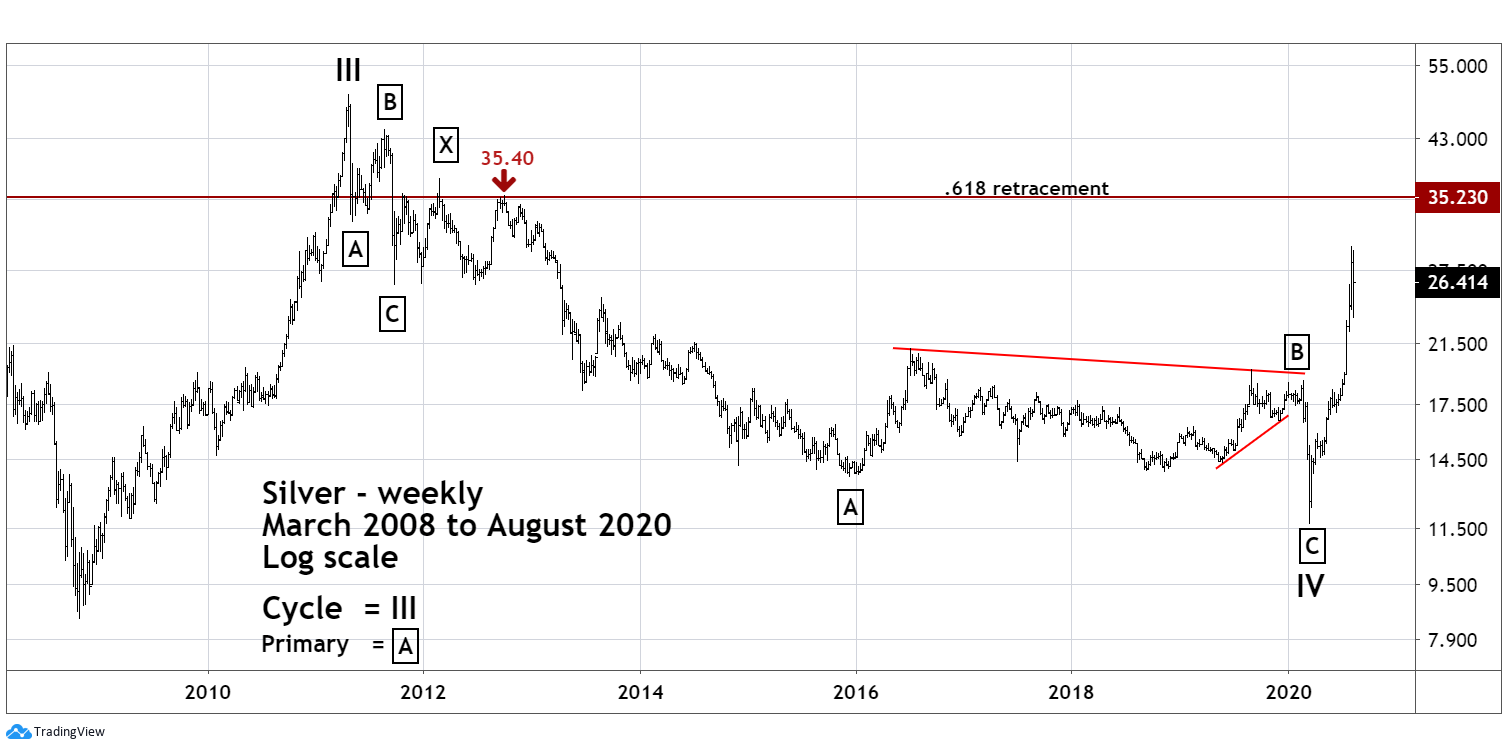
| Silver - Long-Term Please see the Silver weekly chart illustrated in Figure 3. In about four and a half months Silver has retraced more than seven years of bear market action! This alone is strong evidence that Silver could be in the kickoff phase of a larger bull market. Silver could be rallying into a Fibonacci .618 retracement of the entire bear market from 2011 to 2020. Fibonacci .618 is frequently an important support/resistance point. Additionally, the ratio is remarkably close to chart resistance made on October 1, 2012. These two nearby coordinates could be magnets drawing price up, then terminating the rally. |
|
| Figure 3. In about four and a half months Silver has retraced more than seven years of bear market action! |
| Graphic provided by: TradingView. |
| |
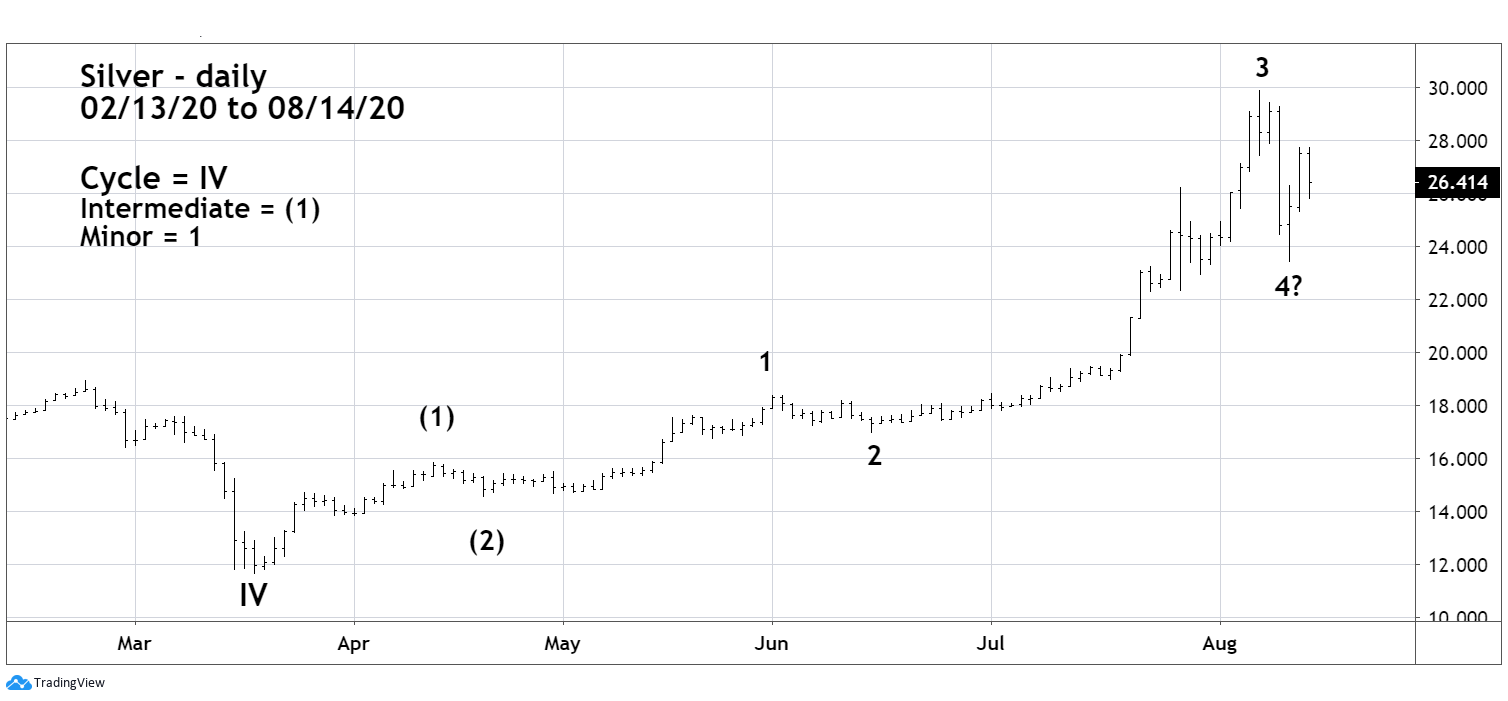
| Silver - Short-Term Please see the Silver daily chart illustrated in Figure 4. Because Silver's recent rally come off a bear market bottom it provides a better Elliott Wave road map than Gold. From an Elliott Wave perspective, Silver is further along in its development than Gold. As of August 14, Silver may have completed Minor wave "4" of Intermediate wave (3). Note, the rally peak on August 7 could also be the termination point for Intermediate wave (3). This alternate wave count will be discussed at a later date if necessary. If Silver completes five Intermediate degree waves from its March 2020 bottom and is near, or at, the major .618 resistance, it could be powerful evidence that the bull move from March 18 is complete. |
|
| Figure 4. Because Silvers recent rally came off a bear market bottom it provides a better Elliott Wave road map than Gold. |
| Graphic provided by: TradingView. |
| |
| Near-Term Strategy With clear Elliott Wave patterns in an uptrend, watch for opportunities to enter long Gold and Silver positions. Gold making new all-time highs and Silver's powerful bear market retracement are clues that a multi-year precious metals bull market could be underway. However, we need to take one forecast at a time. Let's see if Silver can reach and stop at the .618 bear market retracement. If Silver stops at the resistance zone it could help us prepare for the next precious metals phase. Further Reading: Frost A.J and Robert Prechter (1985) "Elliott Wave Principle", New Classics Library. |
Independent investment advisor, trader and writer. He has written articles for Technical Analysis of Stocks & Commodities, Traders.com Advantage,Futuresmag.com and, Finance Magnates. Author of website Four Dimension Trading.
| Website: | www.fourdimensiontrading.com |
| E-mail address: | markrivest@gmail.com |
Click here for more information about our publications!
PRINT THIS ARTICLE

Request Information From Our Sponsors
- VectorVest, Inc.
- Executive Premier Workshop
- One-Day Options Course
- OptionsPro
- Retirement Income Workshop
- Sure-Fire Trading Systems (VectorVest, Inc.)
- Trading as a Business Workshop
- VectorVest 7 EOD
- VectorVest 7 RealTime/IntraDay
- VectorVest AutoTester
- VectorVest Educational Services
- VectorVest OnLine
- VectorVest Options Analyzer
- VectorVest ProGraphics v6.0
- VectorVest ProTrader 7
- VectorVest RealTime Derby Tool
- VectorVest Simulator
- VectorVest Variator
- VectorVest Watchdog
- StockCharts.com, Inc.
- Candle Patterns
- Candlestick Charting Explained
- Intermarket Technical Analysis
- John Murphy on Chart Analysis
- John Murphy's Chart Pattern Recognition
- John Murphy's Market Message
- MurphyExplainsMarketAnalysis-Intermarket Analysis
- MurphyExplainsMarketAnalysis-Visual Analysis
- StockCharts.com
- Technical Analysis of the Financial Markets
- The Visual Investor