HOT TOPICS LIST
- MACD
- Fibonacci
- RSI
- Gann
- ADXR
- Stochastics
- Volume
- Triangles
- Futures
- Cycles
- Volatility
- ZIGZAG
- MESA
- Retracement
- Aroon
INDICATORS LIST
LIST OF TOPICS
PRINT THIS ARTICLE
by Mark Rivest
What happens when election results are uncertain?
Position: N/A
Mark Rivest
Independent investment advisor, trader and writer. He has written articles for Technical Analysis of Stocks & Commodities, Traders.com Advantage,Futuresmag.com and, Finance Magnates. Author of website Four Dimension Trading.
PRINT THIS ARTICLE
SEASONAL TRADING
US Presidential Elections And The Stock Market - Part Two
11/19/20 05:00:04 PMby Mark Rivest
What happens when election results are uncertain?
Position: N/A
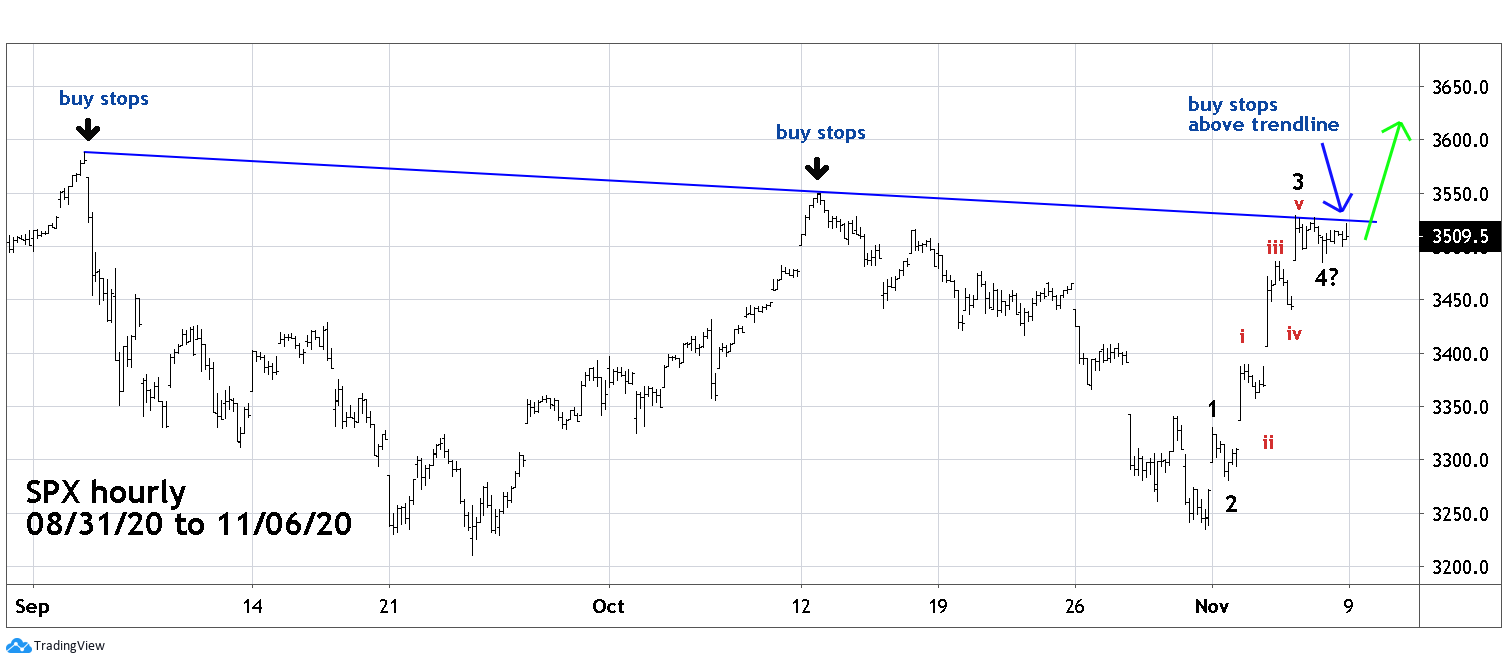
| One cliche made by some market analysts is that "the market hates uncertainty". This is a ridiculous statement to make because it assumes there's market certainty, and when is there certainty? Never. Analysts and traders deal with probabilities not certainties. An examination of the US stock market reaction to the 2020 elections is a great learning tool. S&P 500 - Hourly On 11/04/20, the day after the US Presidential election, the S&P 500 (SPX) had a gap up opening and the high for that day was 3.5% above the prior day close. If you had asked market analysts what they thought could happen if there was no announced winner, many may have predicted stocks going down. But there was huge buying on the "uncertainty" of the election. Stocks discount the future and there are many factors that could explain market trends. Technical analysis provides tools that can help determine the trend and sometimes catch market turns. Please see the hourly SPX chart illustrated in Figure 1. My November 3 article written on November 1, "US Presidential Elections and the Stock Market" noted two bullish factors: November is a seasonally bullish month and a bullish divergence of the Dow Jones Transportation Average vs. the SPX. The SPX bottomed on 10/30/20. The Elliott Wave pattern from early September to the end of October is subject to interpretation, butthe move up from 10/30/20 is clear. The rapid climb has the characteristic of a developing extended Elliott Impulse wave. Extended Impulse waves occur when one of the sub waves also clearly divide into five parts. The SPX on 11/06/20 paused at the declining trendline from the SPX all-time high on 09/02/20. This could be setting up a domino effect from potential stop-buy orders. First, stop-buy orders above the trendline could be triggered propelling the SPX up to the 10/12/20 peak and triggering buy-stops above that top. Very soon the SPX could be at a new all-time high. |

|
| Figure 1. The rapid climb has the characteristic of a developing extended Elliott Impulse wave. |
| Graphic provided by: TradingView. |
| |
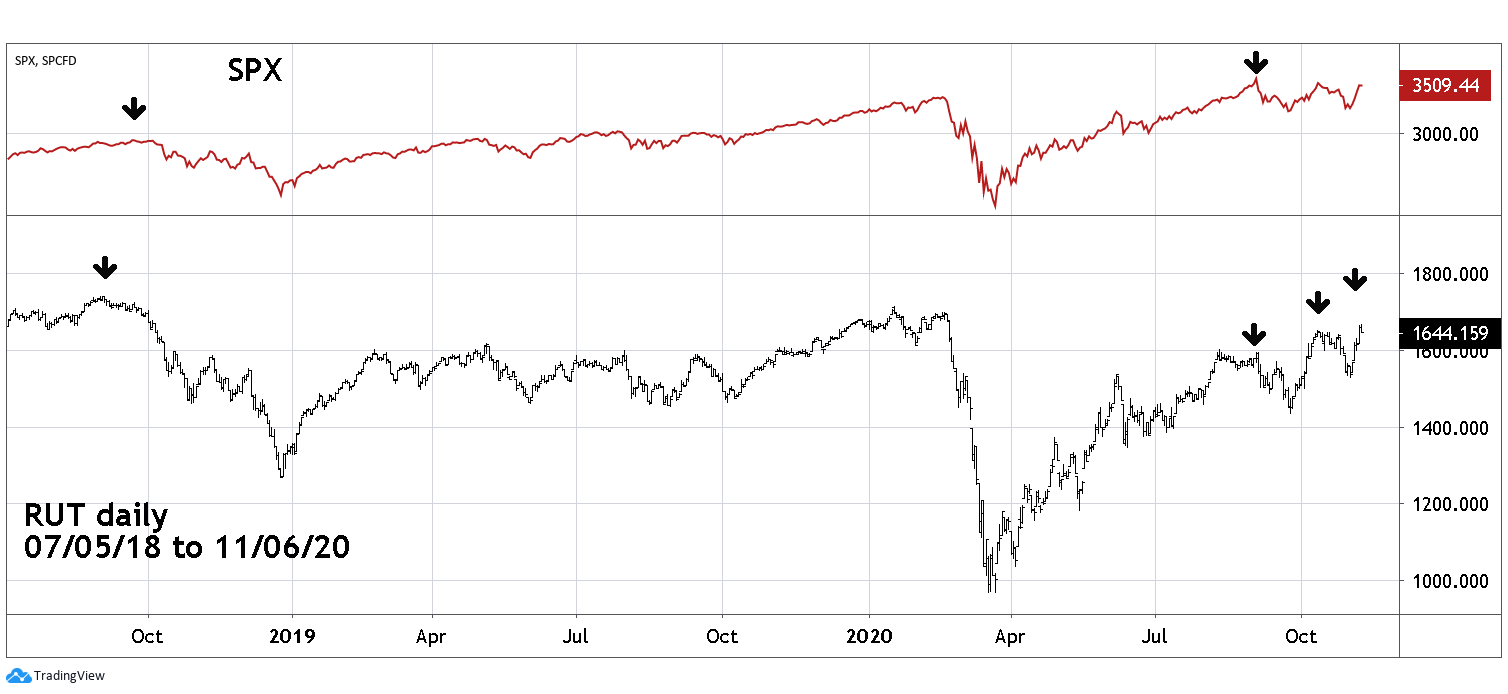
| Russell 2000 Please see the daily Russell 2000 (RUT) and SPX chart illustrated in Figure 2. My 11/03/20 article noted the recent bullish strength of the Emerging Market ETF (EEM) — the RUT composed of small caps stocks is another example. Since late August 2018 RUT has underperformed the SPX. But look at RUT's recent activity. After the 09/24/20 bottom RUT has been stronger than SPX. First by exceeding its 09/02/20 high on 10/12/20, while the SPX failed. In early November RUT was above its 10/12/20 top while the SPX still hasn't gone above its 10/12/20 high. Bullish speculation in small cap stocks is a phenomenon of late stage bull markets and they usually peak before the larger capitalized stocks reach their summit. If within the next several weeks the RUT begins to underperform the SPX it could be a sign of a looming bear market. |

|
| Figure 2. Bullish speculation in small cap stocks is a phenomenon of late stage bull markets. |
| Graphic provided by: TradingView. |
| |
| The Weight of the Evidence Market analysis deals with probabilities not certainties. To determine likely trends focus on the weight of evidence. Currently, three of the four market dimensions are bullish for US stocks. Time: Seasonally bullish until at least the end of 2020. Momentum: Bullish strength from previously underperforming sectors. Price: Bullish Elliott wave patterns. In late 2020 the weight of the evidence for US stocks is bullish. No methodology is perfect, but this system is probably better than listening to market cliche for guidance. Further Reading: Frost A.J and Robert Prechter (1985) "Elliott Wave Principle", New Classics Library. |
Independent investment advisor, trader and writer. He has written articles for Technical Analysis of Stocks & Commodities, Traders.com Advantage,Futuresmag.com and, Finance Magnates. Author of website Four Dimension Trading.
| Website: | www.fourdimensiontrading.com |
| E-mail address: | markrivest@gmail.com |
Click here for more information about our publications!
PRINT THIS ARTICLE

Request Information From Our Sponsors
- VectorVest, Inc.
- Executive Premier Workshop
- One-Day Options Course
- OptionsPro
- Retirement Income Workshop
- Sure-Fire Trading Systems (VectorVest, Inc.)
- Trading as a Business Workshop
- VectorVest 7 EOD
- VectorVest 7 RealTime/IntraDay
- VectorVest AutoTester
- VectorVest Educational Services
- VectorVest OnLine
- VectorVest Options Analyzer
- VectorVest ProGraphics v6.0
- VectorVest ProTrader 7
- VectorVest RealTime Derby Tool
- VectorVest Simulator
- VectorVest Variator
- VectorVest Watchdog
- StockCharts.com, Inc.
- Candle Patterns
- Candlestick Charting Explained
- Intermarket Technical Analysis
- John Murphy on Chart Analysis
- John Murphy's Chart Pattern Recognition
- John Murphy's Market Message
- MurphyExplainsMarketAnalysis-Intermarket Analysis
- MurphyExplainsMarketAnalysis-Visual Analysis
- StockCharts.com
- Technical Analysis of the Financial Markets
- The Visual Investor
