HOT TOPICS LIST
- MACD
- Fibonacci
- RSI
- Gann
- ADXR
- Stochastics
- Volume
- Triangles
- Futures
- Cycles
- Volatility
- ZIGZAG
- MESA
- Retracement
- Aroon
INDICATORS LIST
LIST OF TOPICS
PRINT THIS ARTICLE
by Andrew Hetherington
All charts on the Dow seem ready to jump topside.
Position: N/A
Andrew Hetherington
Classic Dow Theorist who trades as a pure technician, using pattern recognition.
PRINT THIS ARTICLE
CHART ANALYSIS
The Dow Update
01/07/03 02:07:01 PMby Andrew Hetherington
All charts on the Dow seem ready to jump topside.
Position: N/A
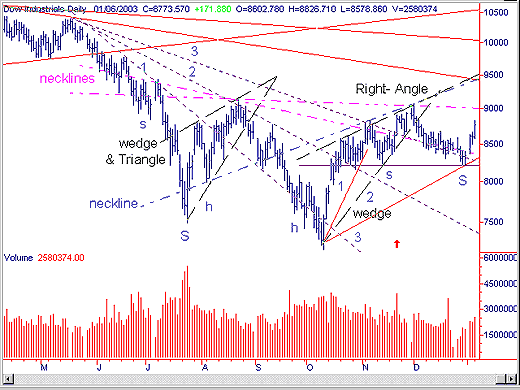
 Figure 1: The Dow Industrials daily chart. All the charts on the Dow look similar or are in bullish formations. They haven't all completed their patterns quite yet but some have already broken topside. Some breached their necklines but never really broke them with any authority. Others backed away from their breakouts temporarily. But now they all seem ready to jump topside. |
| This crowded chart has many trendlines and formations to be illustrated. In my last Dow update (posted 9/25/02), I suggested that the 7300 or 7000 support would be the inevitable bounce upwards. It went as low as 7177 on October 10 but had 380 million shares on the volume and the index closed near the high of the day, up 247 points. This was a fairly predictable bottom once again along the broadening top line from 1999. In addition, I suggested the bounce upwards would not go beyond the neckline, which at that time was in the 8200-8300 areas. Naturally, this line slopes upwards and has changed considerably. Currently, this neckline from the small head and shoulders in July and August is sloped up towards the 9500 area. There are several resistance lines in this neighborhood and without strong volume this will likely be a good stopping place for the next rally, at least temporarily. If the breakout on the larger head and shoulders pattern in the 9000 area occurs, then it should also stop at approximately 9500 before the inevitable throwback to the neckline in the 9000 area. If this anticipated breakout of the larger head and shoulders pattern is not accompanied by heavy volume then it will be an untrustworthy event and taking a short position after the breakout would be the prudent trade. |

|
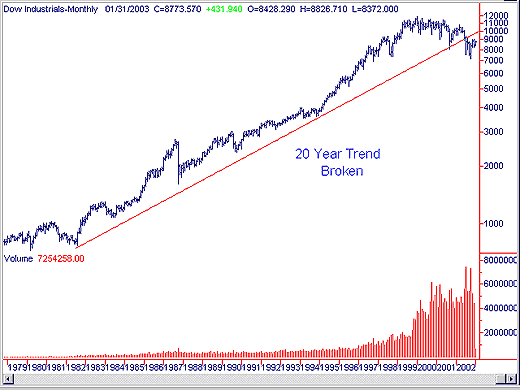
| Figure 2: The Dow Industrials monthly chart. |
| Graphic provided by: SuperCharts. |
| |
| However, watch the volume closely. If it increases significantly compared to the recent activity then do not take a short position on the breakout, go long after the throwback to the 9000 area intraday and ride it up towards the long term trendline in the 10,000 area. At this point the index will be bouncing off of the long-term trend and this would likely be a good place to take a short position. This long-term trend that was broken in June and July of 2002 is of great significance. The trend was broken and although we are heading higher temporarily, the next move after this should be lower. The breaking of this long-term trend cannot be emphasized enough. These trends are not broken every day and you must adhere to their warning when it happens. In my earlier article I discussed the Dow going down to the 5800 supports eventually, and we will know this if the 7177 is broken on the next ride down. If the 7177 holds strong on the next ride down then the bottom will have been made. If the 7177 is broken, as I previously predicted, then 5800 would be the next bottom and the likely place to take a long position. It will hesitate along the way but when the Dow reaches 5800 it will be the time to go long. |
| There are multiple formations within this Dow chart. I've explained my theory of patterns within patterns ("Pattens Within Pattern," posted 2/26/02) and this is a good illustration of this theory. In June, July and August a rising wedge formed within the small head and shoulders pattern. These patterns fulfilled their destiny and their required minimum measurements. In October and November another rising wedge formed, which is common on the shoulders of a head and shoulder pattern. This wedge was within a right-angled broadening formation from October until January. Take note of the rising neckline from the small head and shoulders pattern, which is forming the top line of the right-angled broadening formation. This formation may turn out to be another head and shoulders top, and I'll wait and before closing my thoughts on this pattern. But these types of broadening formations, and head and shoulder top patterns both have bearish tendencies. The volume is acceptable for both formations. All of these patterns have formed within two larger head and shoulders bottom consolidation patterns. The first has two small shoulders lasting only a few weeks with a double head (lower case lettering in the chart) in July and October. The second (upper case) has not been completed quite yet and has a neckline in the 9000 area with the right shoulder being completed in January 2003. |
| The third fan line was broken on November 21 with huge volume changing the temporary direction from down to up. The customary throwback to the line gives an opportunity to take a long position prior to the next breakout at the 9000 area. I am waiting for a significant increase in volume to have the breakout I anticipate on the larger head and shoulders pattern. There is trepidation in the market right now, uneasiness from uncertainty. This leads to volatility. This may hurt the breakouts I am anticipating so I must concentrate on the volume side of the puzzle. Over the holidays light volume must be discounted. However, we are back to our so-called normalcy as of January 6. If the volumes continue to be light over the next few weeks then the safest place is on the sidelines waiting for the next signal. |
Classic Dow Theorist who trades as a pure technician, using pattern recognition.
| Toronto, Canada |
Click here for more information about our publications!
Comments
Date: 01/07/03Rank: 5Comment:
Date: 01/07/03Rank: 4Comment:
Date: 01/08/03Rank: 5Comment:
Date: 01/14/03Rank: 5Comment: Well thought and observed article.
Q:In order to satisfy 9000 breakout what kind of volume would you expect in terms of its significance?
Date: 01/14/03Rank: 5Comment:
Date: 01/14/03Rank: 5Comment: Mr. Hetherington: Very informative, and once again, thankyou for sharing your knowledge, Tom
Date: 01/14/03Rank: 5Comment: Mr. Hetherington: Very informative, and once again, thankyou for sharing your knowledge, Tom

|

Request Information From Our Sponsors
- StockCharts.com, Inc.
- Candle Patterns
- Candlestick Charting Explained
- Intermarket Technical Analysis
- John Murphy on Chart Analysis
- John Murphy's Chart Pattern Recognition
- John Murphy's Market Message
- MurphyExplainsMarketAnalysis-Intermarket Analysis
- MurphyExplainsMarketAnalysis-Visual Analysis
- StockCharts.com
- Technical Analysis of the Financial Markets
- The Visual Investor
- VectorVest, Inc.
- Executive Premier Workshop
- One-Day Options Course
- OptionsPro
- Retirement Income Workshop
- Sure-Fire Trading Systems (VectorVest, Inc.)
- Trading as a Business Workshop
- VectorVest 7 EOD
- VectorVest 7 RealTime/IntraDay
- VectorVest AutoTester
- VectorVest Educational Services
- VectorVest OnLine
- VectorVest Options Analyzer
- VectorVest ProGraphics v6.0
- VectorVest ProTrader 7
- VectorVest RealTime Derby Tool
- VectorVest Simulator
- VectorVest Variator
- VectorVest Watchdog
