

HOT TOPICS LIST
- MACD
- Fibonacci
- RSI
- Gann
- ADXR
- Stochastics
- Volume
- Triangles
- Futures
- Cycles
- Volatility
- ZIGZAG
- MESA
- Retracement
- Aroon
INDICATORS LIST
LIST OF TOPICS
PRINT THIS ARTICLE
by Mark Rivest
What are the bullish implications of the S&P 500 and Nasdaq at all-time highs?
Position: N/A
Mark Rivest
Independent investment advisor, trader and writer. He has written articles for Technical Analysis of Stocks & Commodities, Traders.com Advantage,Futuresmag.com and, Finance Magnates. Author of website Four Dimension Trading.
PRINT THIS ARTICLE
ELLIOTT WAVE
Stock Indices Converging - Part Two
09/03/20 04:16:43 PMby Mark Rivest
What are the bullish implications of the S&P 500 and Nasdaq at all-time highs?
Position: N/A
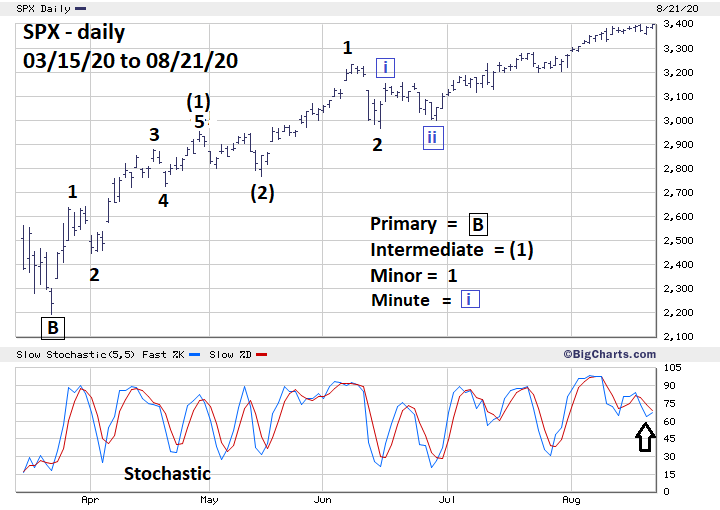
| On August 18, 2020, the S&P 500 (SPX) joined the Nasdaq Composite (COMP) in making new all-time highs. Dow Theory states a bull market confirmation signal occurs when the Dow Jones Industrial Average (DJIA) and the Dow Jones Transportation Average both make new bull market highs. Much has changed since the early twentieth century when this indicator was developed. Perhaps now we should be observing the action among the three main US stock indices, SPX, DJIA, and COMP, for confirming/non confirming bull market signals. S&P 500 Please see the daily SPX chart illustrated in Figure 1. From an Elliott Wave perspective, the SPX could be in the third of a third wave up, which is usually very bullish. In Elliott Theory the basic five wave pattern is a component of the next higher degree five wave structure. The growth process continues to infinity. Note the supposed Intermediate wave (1) subdivides into five waves. The developing Intermediate wave (3) appears to have completed its first and second waves, while developing Minor wave 3 could also be subdividing. The result is what's referred to as a series of one's and two's up. It is usually a long steady rally with short and shallow corrections. Exactly what's been happening in August. Very short-term, the week ending August 21 may have been a small base implying more upside action in the last week of August. Daily Stochastic had a moderate drop and appears to be on the verge of a bullish crossover. The strongest piece of bearish evidence is that as of August 21 the SPX was only marginally above its February 2020 top, and is within the leeway of a Fibonacci 1/1 ratio of the February to March decline. If the SPX moves down from this potential Fibonacci resistance it could mean a double top is in place. This bearish scenario will be discussed in a future article if necessary. |
|
| Figure 1. From an Elliott Wave perspective, the SPX could be in the third of a third wave up. |
| Graphic provided by: BigCharts.com. |
| |
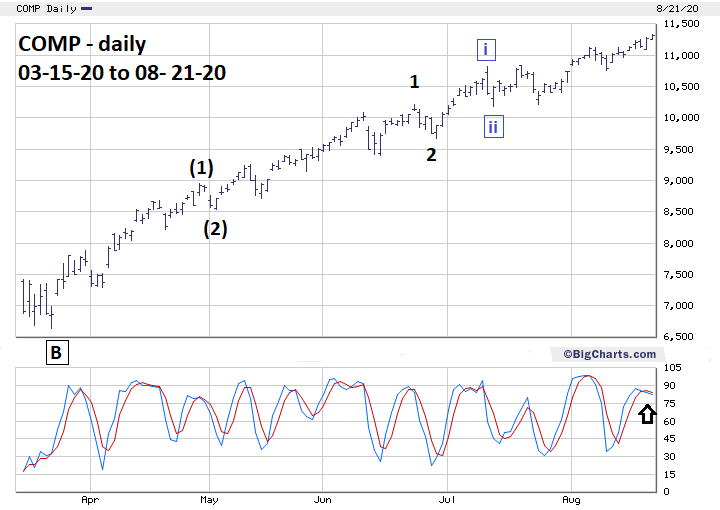
| Nasdaq Composite Please see the daily COMP chart illustrated in Figure 2. On June 5 COMP was the first of the three main US stock indices to make a new all-time high, and until August was a potential bearish signal. The SPX joining COMP at new highs is a bullish confirmation. COMP's rally from late March has been much steadier than the SPX and has many small shallow corrections. This makes counting Elliott waves difficult. The supposed count illustrated is one of several possible alternate wave counts. The wave count will become clearer with further COMP price action, either up or down. Very short-term, COMP's daily Stochastic is just coming off a bearish crossover in overbought territory, implying a decline may have begun. |
|
| Figure 2. The SPX joining COMP at new highs is a bullish confirmation. |
| Graphic provided by: BigCharts.com. |
| |
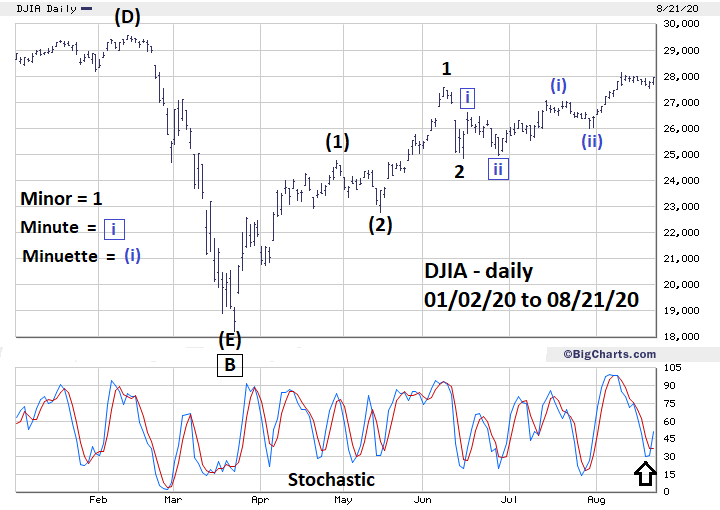
| Dow Jones Industrial Average Please see the daily DJIA chart illustrated in Figure 3. As of August 21, 2020, the DJIA was still below its all-time high, a bearish divergence? No, with three stock indices the truth is probably with the majority. In this case with SPX and COMP making new all-time highs it implies the DJIA will continue along the path of the majority — up. DJIA in a few weeks could also be making a new all-time high. Evidence comes from DJIA's daily Stochastic which on August 21 had a bullish crossover. Perhaps from late August into early September the DJIA could be leading the bull run. |
|
| Figure 3. Perhaps from late August into early September the DJIA could be leading the bull run. |
| Graphic provided by: BigCharts.com. |
| |
| Convergence/Divergence My July 30 article "Stock Index Divergence" noted that in January 2000, all three main US stock indices were making all-time highs. On March 24, 2000, only the SPX had a new all-time high; what followed was a thirty-one-month bear market. After the 2000 to 2002 bear market, US stocks had a five-year bull run which ended in October 2007. On October 31, 2007, the COMP made its bull market peak unaccompanied by the SPX and DJIA and marked the commencement of a seventeen-month bear run. The following scenario could take place in the coming weeks or months. The DJIA joins the SPX and COMP into new all-time highs. They travel together making new highs until one of the three fails to make a new all time high. Later only one of the three main indices is making a new all-time high unconfirmed by the other two indexes. If this happen it could signal the end of the bull run from March 2020 and possibly indicate the termination point for the entire secular bull market since 2009. Further Reading: Frost A.J and Robert Prechter (1985) "Elliott Wave Principle", New Classics Library. |
Independent investment advisor, trader and writer. He has written articles for Technical Analysis of Stocks & Commodities, Traders.com Advantage,Futuresmag.com and, Finance Magnates. Author of website Four Dimension Trading.
| Website: | www.fourdimensiontrading.com |
| E-mail address: | markrivest@gmail.com |
Click here for more information about our publications!
PRINT THIS ARTICLE

Request Information From Our Sponsors
- StockCharts.com, Inc.
- Candle Patterns
- Candlestick Charting Explained
- Intermarket Technical Analysis
- John Murphy on Chart Analysis
- John Murphy's Chart Pattern Recognition
- John Murphy's Market Message
- MurphyExplainsMarketAnalysis-Intermarket Analysis
- MurphyExplainsMarketAnalysis-Visual Analysis
- StockCharts.com
- Technical Analysis of the Financial Markets
- The Visual Investor
- VectorVest, Inc.
- Executive Premier Workshop
- One-Day Options Course
- OptionsPro
- Retirement Income Workshop
- Sure-Fire Trading Systems (VectorVest, Inc.)
- Trading as a Business Workshop
- VectorVest 7 EOD
- VectorVest 7 RealTime/IntraDay
- VectorVest AutoTester
- VectorVest Educational Services
- VectorVest OnLine
- VectorVest Options Analyzer
- VectorVest ProGraphics v6.0
- VectorVest ProTrader 7
- VectorVest RealTime Derby Tool
- VectorVest Simulator
- VectorVest Variator
- VectorVest Watchdog