HOT TOPICS LIST
- MACD
- Fibonacci
- RSI
- Gann
- ADXR
- Stochastics
- Volume
- Triangles
- Futures
- Cycles
- Volatility
- ZIGZAG
- MESA
- Retracement
- Aroon
INDICATORS LIST
LIST OF TOPICS
PRINT THIS ARTICLE
by Mark Rivest
Is the five-year energy stock bear market finished?
Position: N/A
Mark Rivest
Independent investment advisor, trader and writer. He has written articles for Technical Analysis of Stocks & Commodities, Traders.com Advantage,Futuresmag.com and, Finance Magnates. Author of website Four Dimension Trading.
PRINT THIS ARTICLE
ENERGY
Energy Stock Bull Market
06/25/20 04:45:25 PMby Mark Rivest
Is the five-year energy stock bear market finished?
Position: N/A
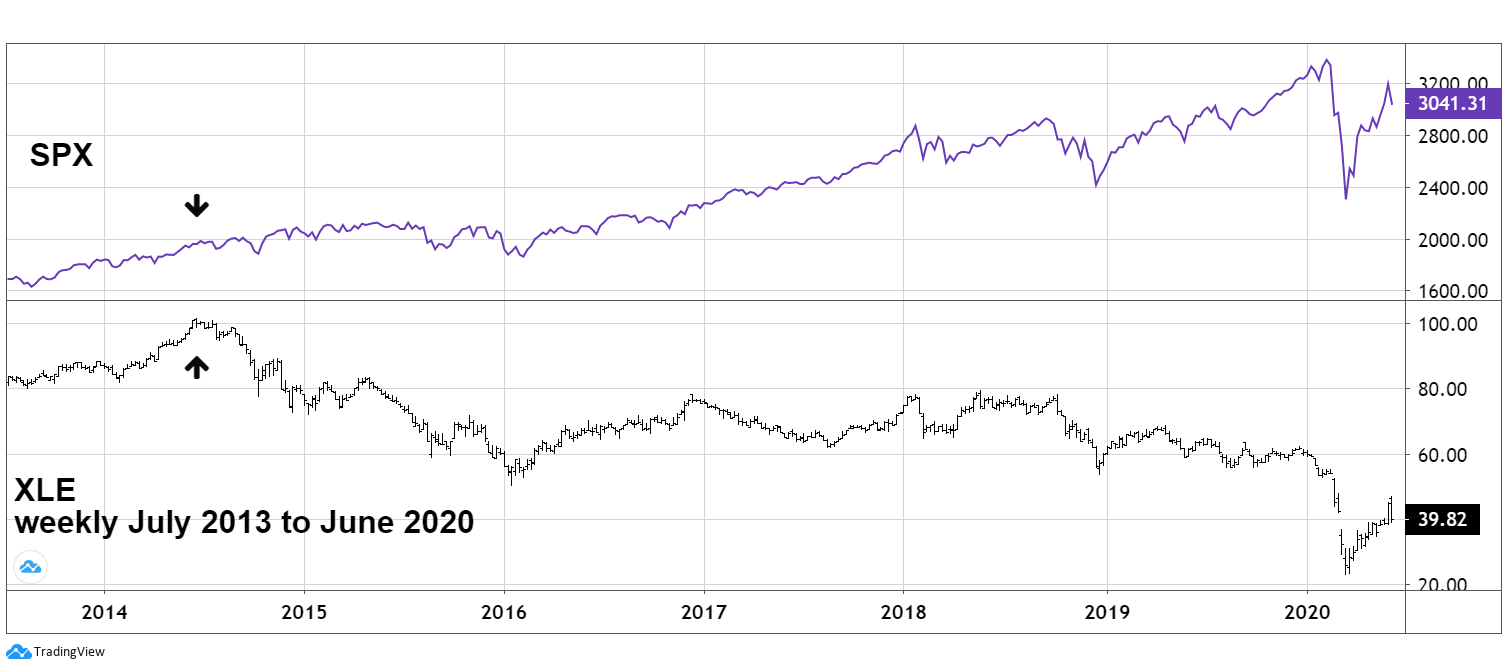
| Since 2014, while the US stock market has relentlessly climbed to new highs within a secular bull market, the energy stocks have plodded to new lows. A role reversal may have begun at the US stock market crash bottom of March 23. The worst performing sector in the last five years could be the best performing sector in the next five years. S&P 500 And Energy Stocks Select Sector SPDR's are Exchange Traded Funds that divide the S&P 500 (SPX) into eleven index funds that trade on the NYSE. The symbol for the energy sector fund is XLE. Please see the weekly SPX and XLE chart illustrated in Figure 1. From the week beginning June 16, 2014 to June 12, 2020 the (SPX) has risen 35.7%. During the same time period XLE has fallen an amazing 60.5%. Near the end of the February to March 2020 crash the situation began to change. XLE made its ultimate low on March 18 at 22.88. Three trading days later, March 23, while the SPX was putting in its crash climax, XLE was making a higher low at 23.15. As of the close on June 12, 2020 the SPX was up 38.7% from its crash bottom, while XLE had risen 74% from its crash low. We could be witnessing the birth of a multi-year period in which energy stocks outperform the broader US stock market. |

|
| Figure 1. From the week beginning June 16, 2014 to June 12, 2020 the (SPX) has risen 35.7%. During the same time period XLE has fallen an amazing 60.5%. |
| Graphic provided by: tradingview.com. |
| |
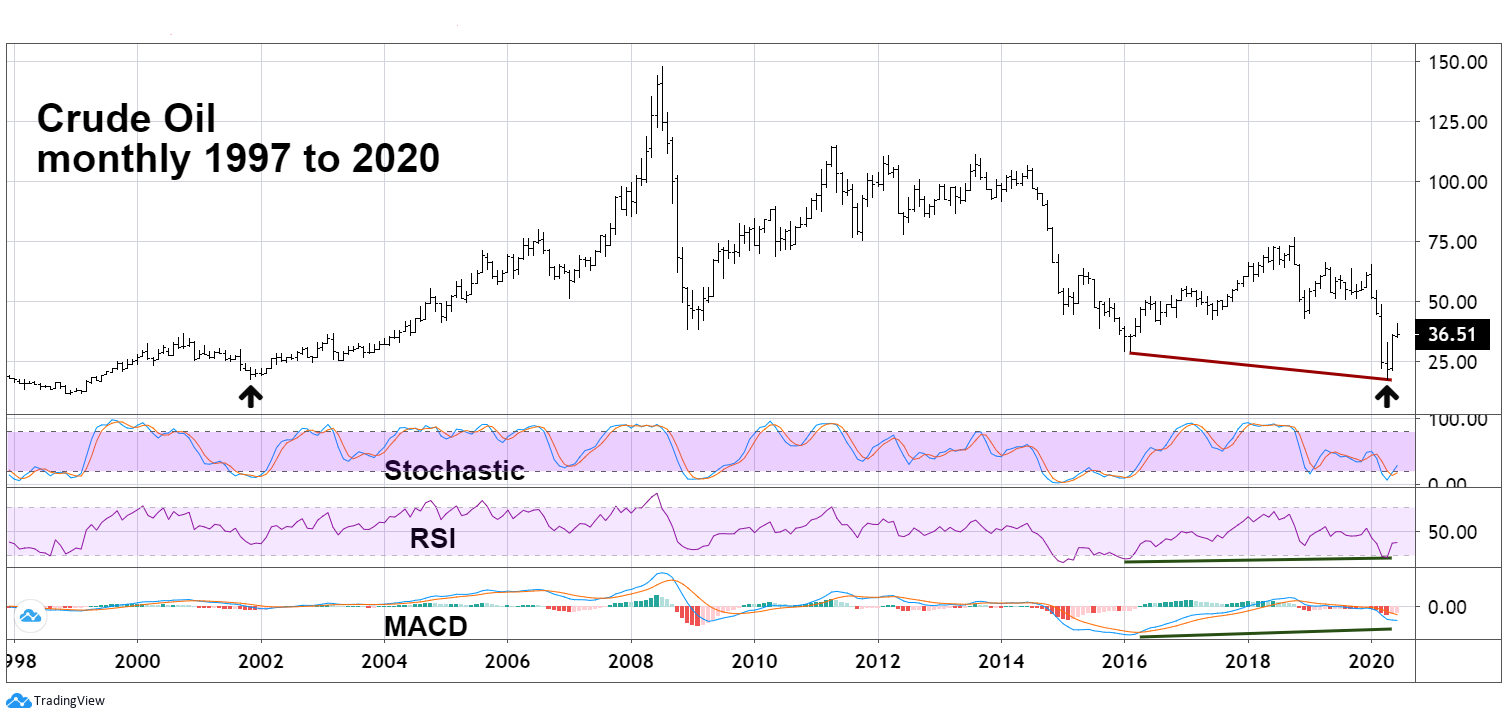
| Crude Oil Monthly The reason energy stocks have been underperforming the broader stock market is because Crude Oil has been in a colossal bear market since July 2008. Please see the monthly Crude Oil chart illustrated in Figure 2. My April 16 article "Crude Oil Plunge" noted that the 2001 bottom in the $17 area could be Crude Oil's next destination and ultimate bear market low. Subsequently, the then current Crude Oil futures contract went below zero. The chart illustrated in Figure 2 shows the monthly continuous next month contract in front. This chart can be found at tradingview.com under the symbol CL2!, and gives a more accurate view of what happened with Crude Oil. The next monthly contract's (April 2020) low was 17.27, and the November 2001 bottom was at 17.30 — almost a direct hit! At the April 2020 low, monthly Stochastic reached the oversold zone and has since had a bullish crossover. Monthly RSI and MACD both have bullish divergences; what's missing is decreased bearish exposure by the Crude Oil Commercials. My April 16 article noted the Commitment of Traders report is a good tool in spotting significant Crude Oil bottoms. The major Oil bottoms in 2009 and 2016 both had Commercials with small net short positions. As of June 12, 2020, the Commercials still haven't reached a net short position at the level expected for a major bottom. This could mean that Crude Oil could break below its April 2020 bottom or the Commercials could reduce their short positions on a subsequent decline that bottoms above the April 2020 low. Keep watch on the Commitment Traders Report — if the Commercials reduce their shorts to levels similar to 2009 and 2016 it could be a signal to buy Crude Oil and energy stocks. |

|
| Figure 2. The next monthly contract's (April 2020) low was 17.27. The November 2001 bottom was at 17.30, almost a direct hit! |
| Graphic provided by: tradingview.com. |
| |
| Role Reversal The US stock market was in a secular bull market from March 2009 to February 2020; a nearly twelve year bull run is long by historical standards. Even if the bull market can make a new all-time high in late 2020 or early 2021 it could be forming a top that holds for years. Crude Oil's nearly twelve-year bear market may have climaxed in April 2020. If not, again age is a key factor. Any break of the April 2020 bottom could lead to a termination of the bear market. The next decline in Crude Oil and energy stocks could be an entry point for long positions. If the shift in strength to energy stocks continues, it's possible they could outperform the broader stock market for several years. Further Reading: Neill B. Humphrey (1985) "The Art of Contrary Thinking" The Caxton Printers. |
Independent investment advisor, trader and writer. He has written articles for Technical Analysis of Stocks & Commodities, Traders.com Advantage,Futuresmag.com and, Finance Magnates. Author of website Four Dimension Trading.
| Website: | www.fourdimensiontrading.com |
| E-mail address: | markrivest@gmail.com |
Click here for more information about our publications!
PRINT THIS ARTICLE

Request Information From Our Sponsors
- StockCharts.com, Inc.
- Candle Patterns
- Candlestick Charting Explained
- Intermarket Technical Analysis
- John Murphy on Chart Analysis
- John Murphy's Chart Pattern Recognition
- John Murphy's Market Message
- MurphyExplainsMarketAnalysis-Intermarket Analysis
- MurphyExplainsMarketAnalysis-Visual Analysis
- StockCharts.com
- Technical Analysis of the Financial Markets
- The Visual Investor
- VectorVest, Inc.
- Executive Premier Workshop
- One-Day Options Course
- OptionsPro
- Retirement Income Workshop
- Sure-Fire Trading Systems (VectorVest, Inc.)
- Trading as a Business Workshop
- VectorVest 7 EOD
- VectorVest 7 RealTime/IntraDay
- VectorVest AutoTester
- VectorVest Educational Services
- VectorVest OnLine
- VectorVest Options Analyzer
- VectorVest ProGraphics v6.0
- VectorVest ProTrader 7
- VectorVest RealTime Derby Tool
- VectorVest Simulator
- VectorVest Variator
- VectorVest Watchdog
