

HOT TOPICS LIST
- MACD
- Fibonacci
- RSI
- Gann
- ADXR
- Stochastics
- Volume
- Triangles
- Futures
- Cycles
- Volatility
- ZIGZAG
- MESA
- Retracement
- Aroon
INDICATORS LIST
LIST OF TOPICS
PRINT THIS ARTICLE
by Mark Rivest
See why Crude Oil could continue to trend lower.
Position: N/A
Mark Rivest
Independent investment advisor, trader and writer. He has written articles for Technical Analysis of Stocks & Commodities, Traders.com Advantage,Futuresmag.com and, Finance Magnates. Author of website Four Dimension Trading.
PRINT THIS ARTICLE
SEASONAL TRADING
Crude Oil Plunge
04/16/20 04:06:21 PMby Mark Rivest
See why Crude Oil could continue to trend lower.
Position: N/A
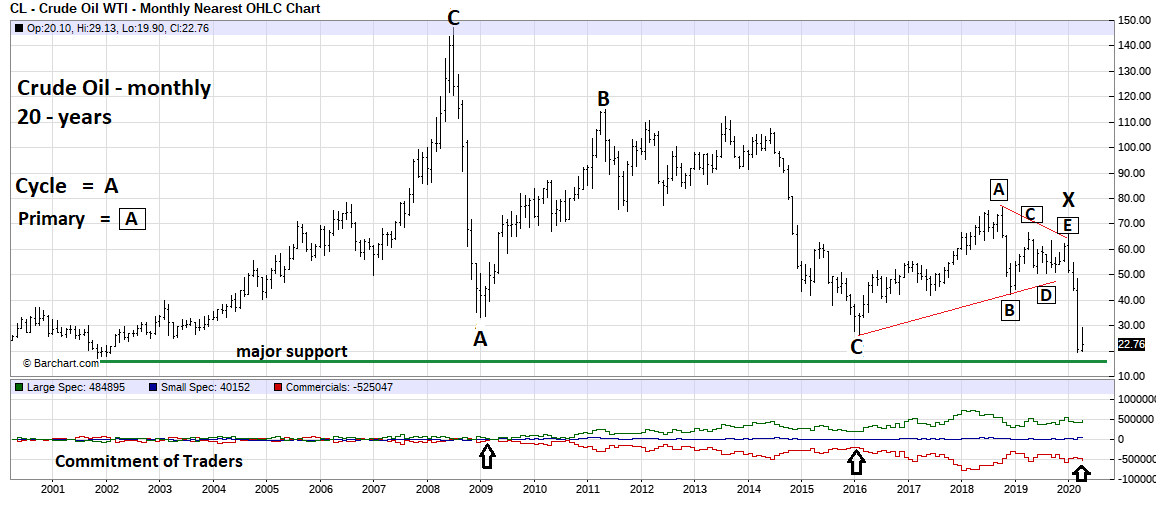
| Almost all markets have seasonal patterns. A market moving counter to its seasonal pattern can be an important clue of a significant rally or decline. Crude Oil is seasonally bullish from mid-December until late-April. The January 2020 $16 decline was an omen for lower prices. Evidence from the dimensions of price, time, and sentiment hint a bearish trend could continue until at least May 2020. Long-Term View On September 14, 2019 an attack on a Saudi Arabian oil instillation triggered a sharp move up in Crude Oil which some suggested could hit $100 a barrel. My September 26, 2019 article "Crude Oil Spike" noted the lack of upside follow though from the attack could cause Oil to decline into at least December. Crude Oil subsequently declined into early October and climbed until January, marginally exceeding the September spike high but holding below the important April 2019 top. Please see the monthly Crude Oil chart illustrated in Figure 1. In Elliott wave terms the January high completed an inverse Horizontal Triangle that had been developing since the major bottom made in 2016. What happened after the January top is a classic example of a post triangle thrust. My September 26 article noted that after completion of the inverse Horizontal Triangle within three to five years Crude Oil could go below the major bottom made in 2016. An Oil price war and economic slow down from the Coronavirus crisis has dramatically accelerated the drop. While, the 2016 bottom target has been reached, the 2001 bottom in the $17 area could be the next destination and ultimate bear market low. Evidence to support this theory comes from the sentiment dimension, specifically the Commitment of Traders report (COT). The COT divides traders into three groups: Large traders, Small traders, and Commercials. The Commercials are the group to follow, as they have most knowledge and Futures contracts. For Crude Oil the Commercials are almost always net short because they need a hedge against price declines. Note that at the recent bottom of $20 the Commercials have not reduced their net shorts to either the 2009 bottom or the 2016 bottom. If Crude Oil goes below $20 watch if the Commercial's reduce their short positions. |
|
| Figure 1. If Crude Oil goes below $20 watch if the Commercials reduce their short positions. |
| Graphic provided by: Barchart.com. |
| |
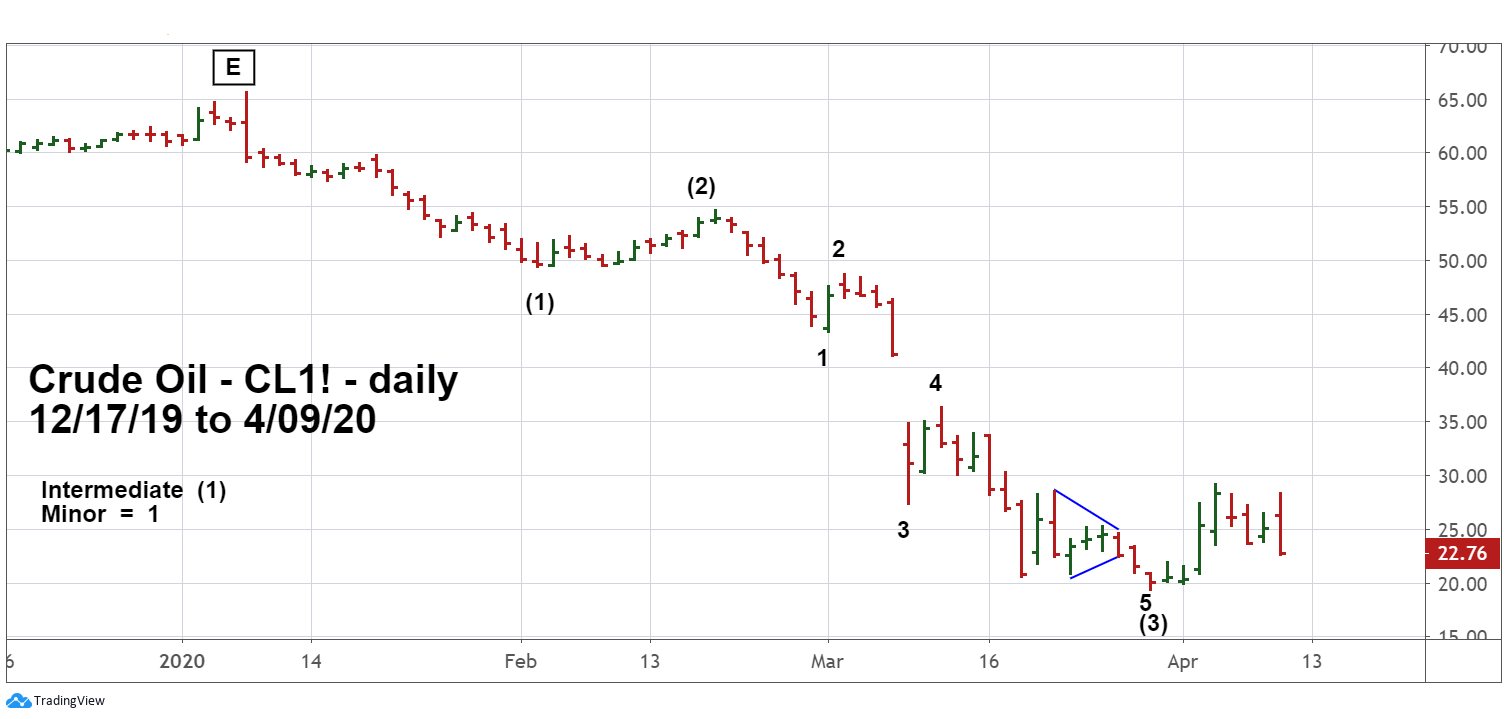
| Short-Term View Please see the daily continuous Crude Oil (CL1!) chart illustrated in Figure 2. The crash from the January peak has a very clear Elliott wave pattern of three complete waves down. The seasonal bullish pattern usually terminates in mid to late April. After such a significant drop during a bullish period, it's likely the rally from the March 30 bottom won't continue into the bearish time zone of late April to early June. The most likely scenario has the post March 30 rally as Intermediate wave (4) followed by a move below the March 30 low. |
|
| Figure 2. The crash from the January peak has a very clear Elliott wave pattern of three complete waves down. |
| Graphic provided by: tradingview.com. |
| |
| Putting The Pieces Together The ongoing Coronavirus crisis is the main fundamental factor depressing Crude Oil. In the US it's possible some restrictions could be lifted at the end of April. New York state is the hardest hit and full restrictions there could remain for at least several weeks. If a weak economy continues it would coincide with a seasonal bearish month of May. It's possible if some restrictions are lifted, Crude Oil could ultimately bottom in late May or early June. If the March 30 bottom is broken, keep an eye on what the Commercials are doing. Reducing their net short positions to at least the level made in 2016 could be a signal of a very important bottom. Further Reading: Frost A.J and Robert Prechter (1985) "Elliott Wave Principle", New Classics Library. Neill B. Humphrey (1985) "The Art of Contrary Thinking" The Caxton Printers. |
Independent investment advisor, trader and writer. He has written articles for Technical Analysis of Stocks & Commodities, Traders.com Advantage,Futuresmag.com and, Finance Magnates. Author of website Four Dimension Trading.
| Website: | www.fourdimensiontrading.com |
| E-mail address: | markrivest@gmail.com |
Click here for more information about our publications!
PRINT THIS ARTICLE

Request Information From Our Sponsors
- VectorVest, Inc.
- Executive Premier Workshop
- One-Day Options Course
- OptionsPro
- Retirement Income Workshop
- Sure-Fire Trading Systems (VectorVest, Inc.)
- Trading as a Business Workshop
- VectorVest 7 EOD
- VectorVest 7 RealTime/IntraDay
- VectorVest AutoTester
- VectorVest Educational Services
- VectorVest OnLine
- VectorVest Options Analyzer
- VectorVest ProGraphics v6.0
- VectorVest ProTrader 7
- VectorVest RealTime Derby Tool
- VectorVest Simulator
- VectorVest Variator
- VectorVest Watchdog
- StockCharts.com, Inc.
- Candle Patterns
- Candlestick Charting Explained
- Intermarket Technical Analysis
- John Murphy on Chart Analysis
- John Murphy's Chart Pattern Recognition
- John Murphy's Market Message
- MurphyExplainsMarketAnalysis-Intermarket Analysis
- MurphyExplainsMarketAnalysis-Visual Analysis
- StockCharts.com
- Technical Analysis of the Financial Markets
- The Visual Investor