

HOT TOPICS LIST
- MACD
- Fibonacci
- RSI
- Gann
- ADXR
- Stochastics
- Volume
- Triangles
- Futures
- Cycles
- Volatility
- ZIGZAG
- MESA
- Retracement
- Aroon
INDICATORS LIST
LIST OF TOPICS
PRINT THIS ARTICLE
by Mark Rivest
See why attack on oil installation may not result in $100 a barrel Crude Oil.
Position: Sell
Mark Rivest
Independent investment advisor, trader and writer. He has written articles for Technical Analysis of Stocks & Commodities, Traders.com Advantage,Futuresmag.com and, Finance Magnates. Author of website Four Dimension Trading.
PRINT THIS ARTICLE
SEASONAL TRADING
Crude Oil Spike
09/26/19 04:43:19 PMby Mark Rivest
See why attack on oil installation may not result in $100 a barrel Crude Oil.
Position: Sell
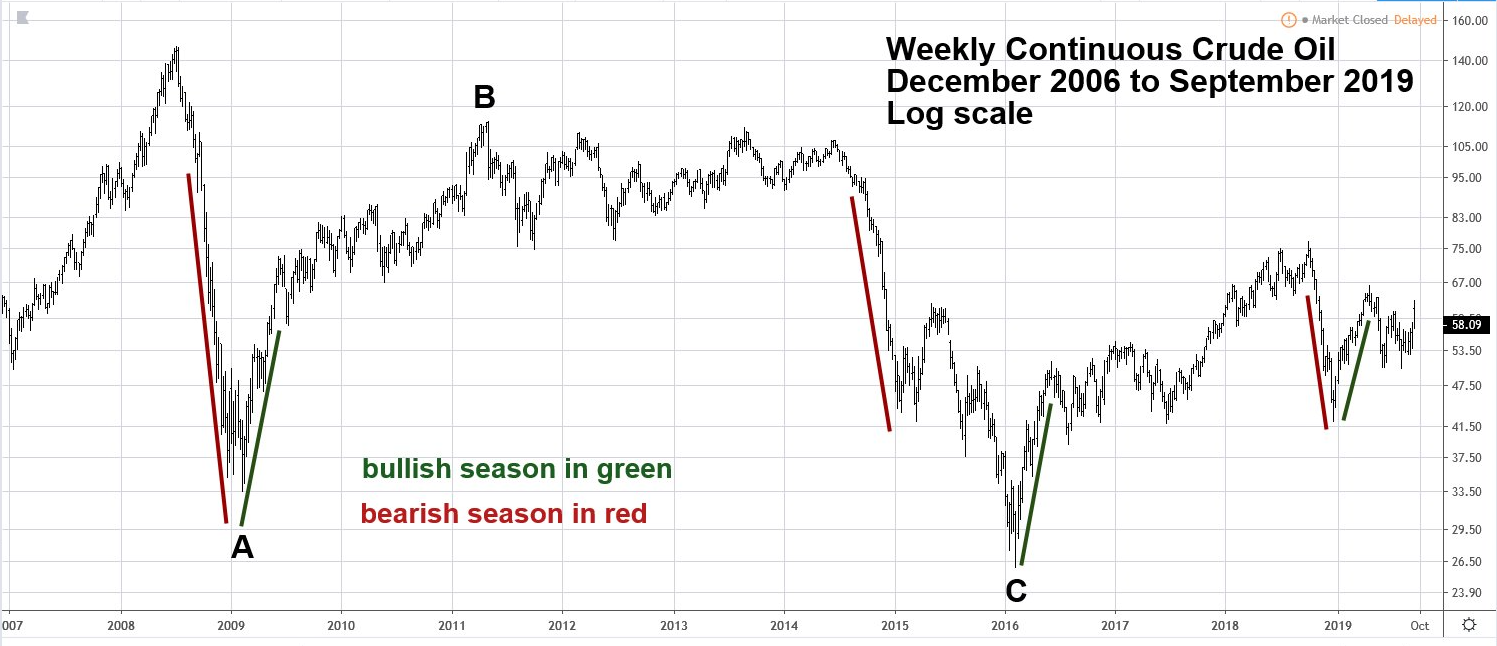
| Whenever you see a headline making a spectacular claim about a potential market move — be suspicious. Just after the September 14 attack on Saudi Arabian oil installations, one news headline speculated that Crude Oil could hit $100 a barrel. Major market moves usually come as a complete surprise to most people. Market analysis requires work, it's doubtful the answers can be found by simply reading a headline. Crude Oil - Seasonal Patterns As noted in my September 19 article "Bearish Months for the Stock Market" almost all markets have some sort of seasonal bias. Crude Oil's bullish season runs from December to April and its bear season goes from late August until December. Please see the weekly continuous Crude Oil chart illustrated in Figure 1. Seasonal patterns are not precise, sometimes a market top/bottom could be early or late. Occasionally a market can move counter seasonal. If you see a market going up in a seasonally bearish time it could be a major hint to favor long positions. Markets that ignore seasonal patterns could have some extraordinary factors triggering a large move contrary to what was expected. Crude Oil's move from its all-time high in 2008 to its bear market bottom took the form of an Elliott wave A - B - C Zigzag pattern. Implying that a multi-year bull market that could eventually exceed the 2008 high is underway. The Oil spike up after the attack came in a bearish month; could this be the extraordinary factor that triggers a multi-month move up against the seasonal pattern? Perhaps, but one Elliott wave pattern of Crude's rally since 2016 suggests something else may be happening. |
|
| Figure 1. Crude Oil�s bullish season runs from December to April and its bear season goes from late August until December. |
| Graphic provided by: tradingview.com. |
| |
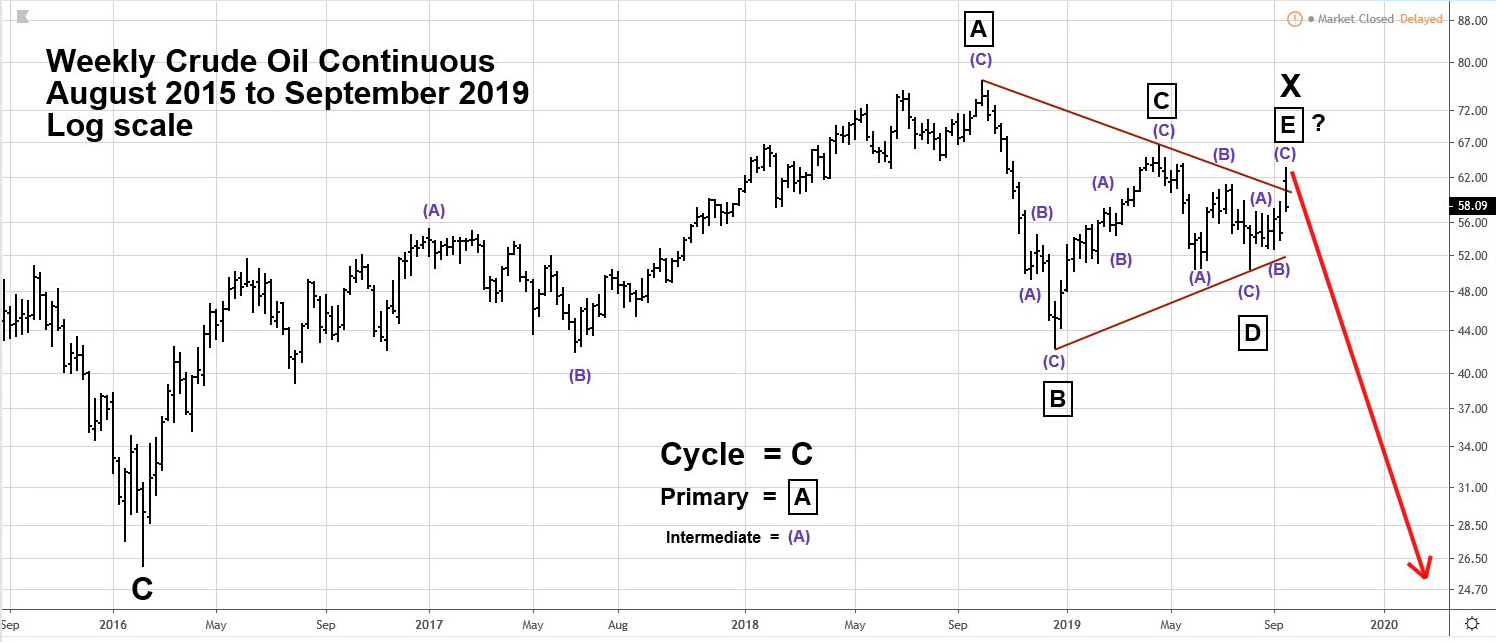
| Crude Oil - Elliott Wave Patterns Please see the weekly continuous Crude Oil chart 2015 to 2019 illustrated in Figure 2. The price movement from the major bottom made in 2016 appears to be an Elliott wave Inverse Horizontal Triangle. This pattern corrects the progress within an ongoing bear market. This means the eight-year Elliott wave Zigzag from 2008 to 2016 could be just the first Zigzag down of a yet to be completed Double Zigzag down. The intervening Inverse Horizontal Triangle is referred to as wave "X" and separates the two Zigzag pattern. If this pattern is correct it implies a new phase of a multi-year Crude Oil bear market that could eventually break below the bottom made in 2016. Each of the five sub waves of Horizontal Triangles sub divide into three waves. Of the illustrated Horizontal Triangle only the supposed Primary wave "C" boxed has a doubtful three wave count. Within Horizontal Triangles the most common Fibonacci relationships occur among alternating waves. For the 2016 to 2019 Horizontal Triangle there are three relationships close to a Fibonacci 50%; wave "C "24.24/50.85 wave "A" = .476, wave "E" 12.86/24.24 wave "C" = .53, wave "D" 16.08/34.54 wave "B" = .465. There's also one relationship close to a Fibonacci 38.2%, wave "E" 12.86/34.54 wave "B" = .372. Note that Primary wave "E" - boxed has a throw over of the of the trendline connecting the peaks of Primary waves "A" and "C". This phenomenon occasionally happens in "E" waves during highly emotional markets. Finally, a Fibonacci time cycle could be in effect. The bear market from 2008 to 2016 was a Fibonacci eight years. The Horizontal Triangle from 2016 to 2019 is a Fibonacci three years. If a new phase of the bear market has begun perhaps it could last a Fibonacci three or five years? |
|
| Figure 2. The price movement from the major bottom made in 2016 appears to be an Elliott wave Inverse Horizontal Triangle. |
| Graphic provided by: tradingview.com. |
| |
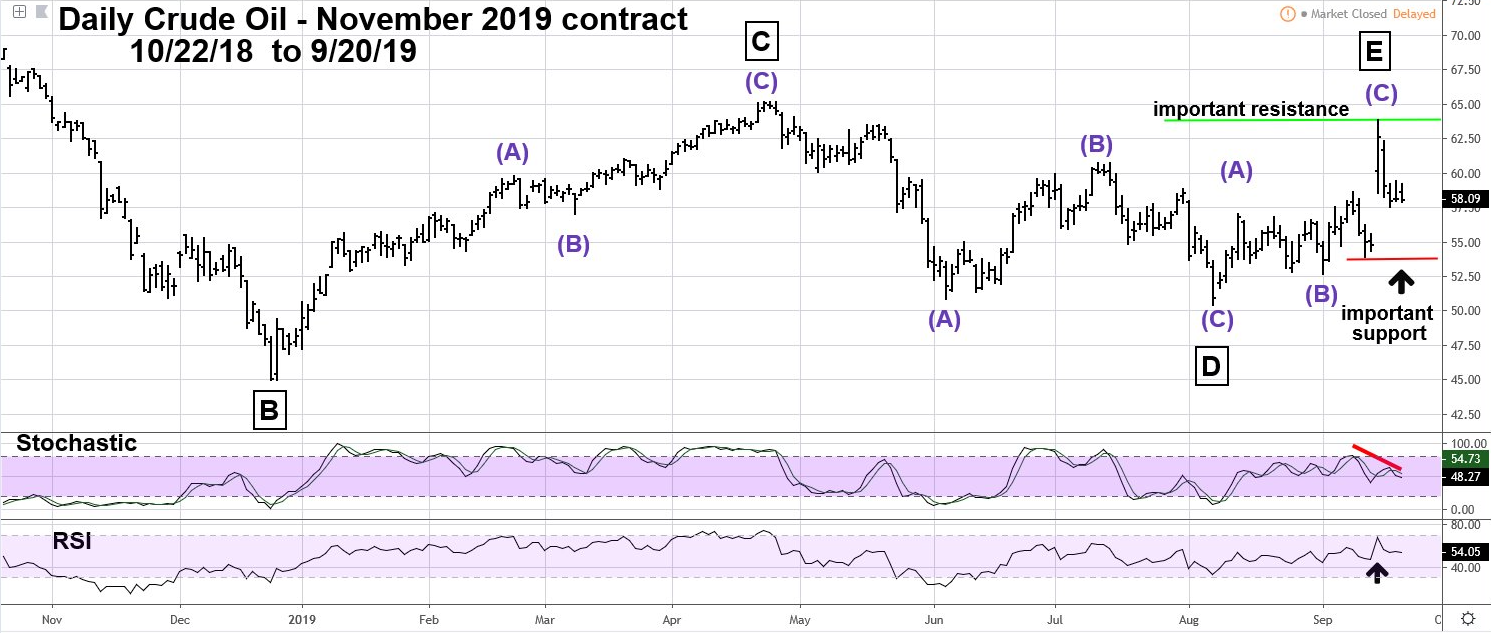
| Crude Oil - Daily Please see the daily Crude Oil - November 2019 contract chart illustrated in Figure 3. The most striking aspect of Crude Oil's September 16 spike up is a complete lack of follow through. Normally, after an initial kick off rally there could at least two or three days of continued upside action. As of September 20, there's been nothing. On the 16th daily Stochastic had a bearish divergence and RSI just reached the edge of the overbought zone. So far momentum of the giant move up has been weak. A move above the high made on September 16 could be very bullish, implying at least a multi-week rally. A break below the September 12 bottom could be very bearish and open the door for a seasonal decline into December. |
|
| Figure 3. The most striking aspect of Crude Oil�s September 16 spike up is a complete lack of follow through. |
| Graphic provided by: tradingview.com. |
| |
| Summary Crude Oil's seasonal pattern is bearish until December 2019. Elliott wave patterns and Fibonacci analysis suggest a correction within a multi-year ongoing bear market could be complete. The September spike up has had no follow through. Daily momentum is bearish. These factors imply that instead of a move up to $100 a barrel, Crude Oil may have begun a journey that could ultimately take it below the bottom made in 2016. Market analysis requires hard work and study, the answers usually don't come easy. Beware of headlines bearing market gifts. Further Reading: Frost A.J and Robert Prechter (1985) "Elliott Wave Principle", New Classics Library. |
Independent investment advisor, trader and writer. He has written articles for Technical Analysis of Stocks & Commodities, Traders.com Advantage,Futuresmag.com and, Finance Magnates. Author of website Four Dimension Trading.
| Website: | www.fourdimensiontrading.com |
| E-mail address: | markrivest@gmail.com |
Click here for more information about our publications!
Comments
Date:�09/28/19Rank:�5Comment:�

Request Information From Our Sponsors
- StockCharts.com, Inc.
- Candle Patterns
- Candlestick Charting Explained
- Intermarket Technical Analysis
- John Murphy on Chart Analysis
- John Murphy's Chart Pattern Recognition
- John Murphy's Market Message
- MurphyExplainsMarketAnalysis-Intermarket Analysis
- MurphyExplainsMarketAnalysis-Visual Analysis
- StockCharts.com
- Technical Analysis of the Financial Markets
- The Visual Investor
- VectorVest, Inc.
- Executive Premier Workshop
- One-Day Options Course
- OptionsPro
- Retirement Income Workshop
- Sure-Fire Trading Systems (VectorVest, Inc.)
- Trading as a Business Workshop
- VectorVest 7 EOD
- VectorVest 7 RealTime/IntraDay
- VectorVest AutoTester
- VectorVest Educational Services
- VectorVest OnLine
- VectorVest Options Analyzer
- VectorVest ProGraphics v6.0
- VectorVest ProTrader 7
- VectorVest RealTime Derby Tool
- VectorVest Simulator
- VectorVest Variator
- VectorVest Watchdog