

HOT TOPICS LIST
- MACD
- Fibonacci
- RSI
- Gann
- ADXR
- Stochastics
- Volume
- Triangles
- Futures
- Cycles
- Volatility
- ZIGZAG
- MESA
- Retracement
- Aroon
INDICATORS LIST
LIST OF TOPICS
PRINT THIS ARTICLE
by Mark Rivest
Discovering strength/weakness in a market movement.
Position: N/A
Mark Rivest
Independent investment advisor, trader and writer. He has written articles for Technical Analysis of Stocks & Commodities, Traders.com Advantage,Futuresmag.com and, Finance Magnates. Author of website Four Dimension Trading.
PRINT THIS ARTICLE
MOMENTUM
Stock Market Confirming Indicators
06/12/20 05:02:39 PMby Mark Rivest
Discovering strength/weakness in a market movement.
Position: N/A
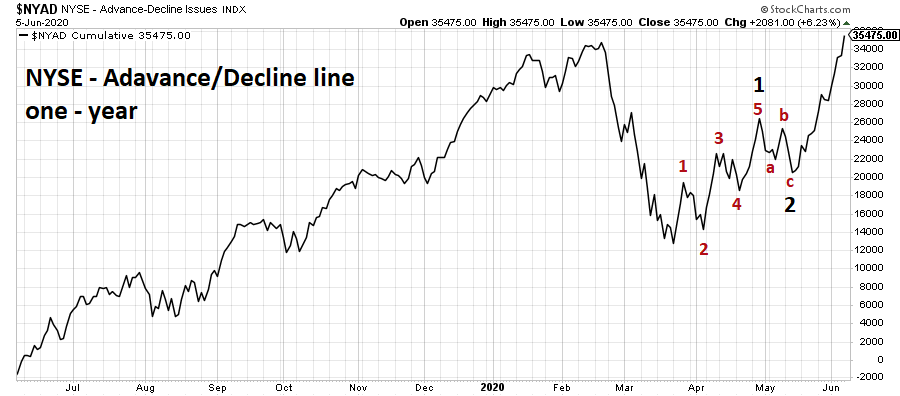
| A market trend up or down could terminate at any moment. Price charts provide clues to potential support/resistance areas and are the primary tool to prepare for trend reversals. A study of the momentum dimension reveals multiple secondary tools that can aid in catching potential market turns. NYSE - Advance/Decline Line Stock markets have an advantage over most other markets in that its momentum can be measured as a whole and by its components. Stock indices are the whole and can be measured by momentum oscillators such as Stochastics or RSI. Beneath the surface are the stocks within an index which can be measured by what are sometimes called internal indicators. Measuring advancing stocks vs declining stocks within an index is a widely used internal momentum indicator. Please see the NYSE Advance/Decline (A/D) line chart illustrated in Figure 1. When a stock index makes a new high/low and it's unconfirmed by the A/D line it's a sign of a potential market reversal. On June 5, the NYSE A/D line made a new high, yet the NYSE stock index (symbol NYA) was more than 10% below its all-time high. This sign of internal strength confirms the rally and implies the NYA could soon reach a new all-time high. An additional bullish clue from the A/D line is how it rallied. The NYSE A/D line from its March 2020 bottom appears to be forming an Elliott wave pattern. The A/D line is currently in a third wave up. If this is the third wave of a developing five wave pattern it implies strong bullish potential. In stocks, the third wave in a developing five wave pattern is usually the longest and strongest wave. It's possible a powerful rally is underway that could continue until at least July. |
|
| Figure 1. On June 5, the NYSE A/D line made a new high, yet the NYSE stock index (NYA) was more than 10% below its all-time high. |
| Graphic provided by: StockCharts.com. |
| |
| S&P 500 - Bullish Percent Index A great tool to dig even further beneath the surface of a stock market index is the Bullish Percent Index. The indicator for the S&P 500 (SPX) can be found at StockCharts.com under the symbol $BPSPX. The Bullish Percent Index measures the percentage of stocks within an index that are on Point and Figure buy signals. Please see the S&P 500 Bullish Percent Index chart illustrated in Figure 2. This is an update to the chart illustrated in my May 29 article "Elliott Wave Crossroads - Part Two". $BPSPX made an all-time high in April 2020 and as of June 5 was close to making another new all-time high. Even if this indicator does not make a new high, it usually takes several months after a $BPSPX peak for an SPX bull move to reach its climax. If the $BPSPX makes a new high, it could potentially push the ultimate SPX high out another six to eight months. |

|
| Figure 2. If the $BPSPX makes a new high, it could potentially push the ultimate SPX high out another six to eight months. |
| Graphic provided by: StockCharts.com. |
| |
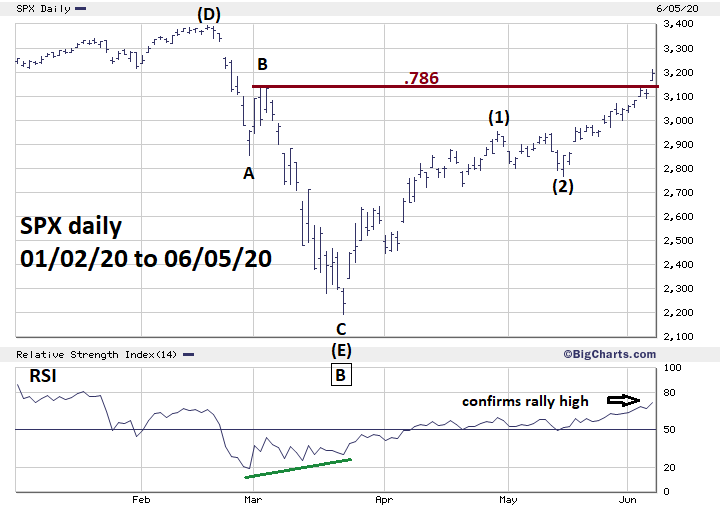
| S&P 500 - Daily Please see the daily SPX chart illustrated in Figure 3. The RSI, when used on stocks or stock indices, almost always signals a potent top when there's at least one bearish divergence. As of June 5, the SPX RSI was at its highest level since it began rising in late February, confirming the new SPX post-crash rally high. Additional confirmation comes from the price dimension with a breakthrough of two Fibonacci resistance points. The first Fibonacci coordinate is a .786 retrace of the February to March decline at SPX 3136.40. The second coordinate comes from a 100% retrace of the decline from the March 3 short-term top at SPX 3136.70. When you have two Fibonacci coordinates remarkably close together it represents powerful support/resistance, which requires powerful force to break. The strong thrust up on June 5 is exactly what was needed to break that resistance. This move not only confirms the ongoing rally, it also implies the SPX could be headed to the next significant Fibonacci resistance area at, or near, the all-time high made in February. |
|
| Figure 3. The strong thrust up on June 5 is exactly what was needed to break resistance. |
| Graphic provided by: BigCharts.com. |
| |
| Wait For Divergences As of early June 2020, the A/D line, Bullish Percent Index, and RSI are all confirming the rally in US stocks. Assuming the rally can continue, at some point divergences will emerge, when they do appear — be patient. Significant stock market tops are typically slow in developing and there could be several divergences over a period of weeks, or even months. There are no awards for selling the top tick. What's important is being on the correct side of a market trend, and the trend change may not be clear until after many divergences followed by a break below significant price support. Further Reading: Frost A.J and Robert Prechter (1985) "Elliott Wave Principle", New Classics Library. |
Independent investment advisor, trader and writer. He has written articles for Technical Analysis of Stocks & Commodities, Traders.com Advantage,Futuresmag.com and, Finance Magnates. Author of website Four Dimension Trading.
| Website: | www.fourdimensiontrading.com |
| E-mail address: | markrivest@gmail.com |
Click here for more information about our publications!
Comments

Request Information From Our Sponsors
- VectorVest, Inc.
- Executive Premier Workshop
- One-Day Options Course
- OptionsPro
- Retirement Income Workshop
- Sure-Fire Trading Systems (VectorVest, Inc.)
- Trading as a Business Workshop
- VectorVest 7 EOD
- VectorVest 7 RealTime/IntraDay
- VectorVest AutoTester
- VectorVest Educational Services
- VectorVest OnLine
- VectorVest Options Analyzer
- VectorVest ProGraphics v6.0
- VectorVest ProTrader 7
- VectorVest RealTime Derby Tool
- VectorVest Simulator
- VectorVest Variator
- VectorVest Watchdog
- StockCharts.com, Inc.
- Candle Patterns
- Candlestick Charting Explained
- Intermarket Technical Analysis
- John Murphy on Chart Analysis
- John Murphy's Chart Pattern Recognition
- John Murphy's Market Message
- MurphyExplainsMarketAnalysis-Intermarket Analysis
- MurphyExplainsMarketAnalysis-Visual Analysis
- StockCharts.com
- Technical Analysis of the Financial Markets
- The Visual Investor