

HOT TOPICS LIST
- MACD
- Fibonacci
- RSI
- Gann
- ADXR
- Stochastics
- Volume
- Triangles
- Futures
- Cycles
- Volatility
- ZIGZAG
- MESA
- Retracement
- Aroon
INDICATORS LIST
LIST OF TOPICS
PRINT THIS ARTICLE
by Mark Rivest
See how the VIX performs in bull and bear markets.
Position: N/A
Mark Rivest
Independent investment advisor, trader and writer. He has written articles for Technical Analysis of Stocks & Commodities, Traders.com Advantage,Futuresmag.com and, Finance Magnates. Author of website Four Dimension Trading.
PRINT THIS ARTICLE
VOLATILITY
VIX Cycles
06/05/20 03:05:49 PMby Mark Rivest
See how the VIX performs in bull and bear markets.
Position: N/A
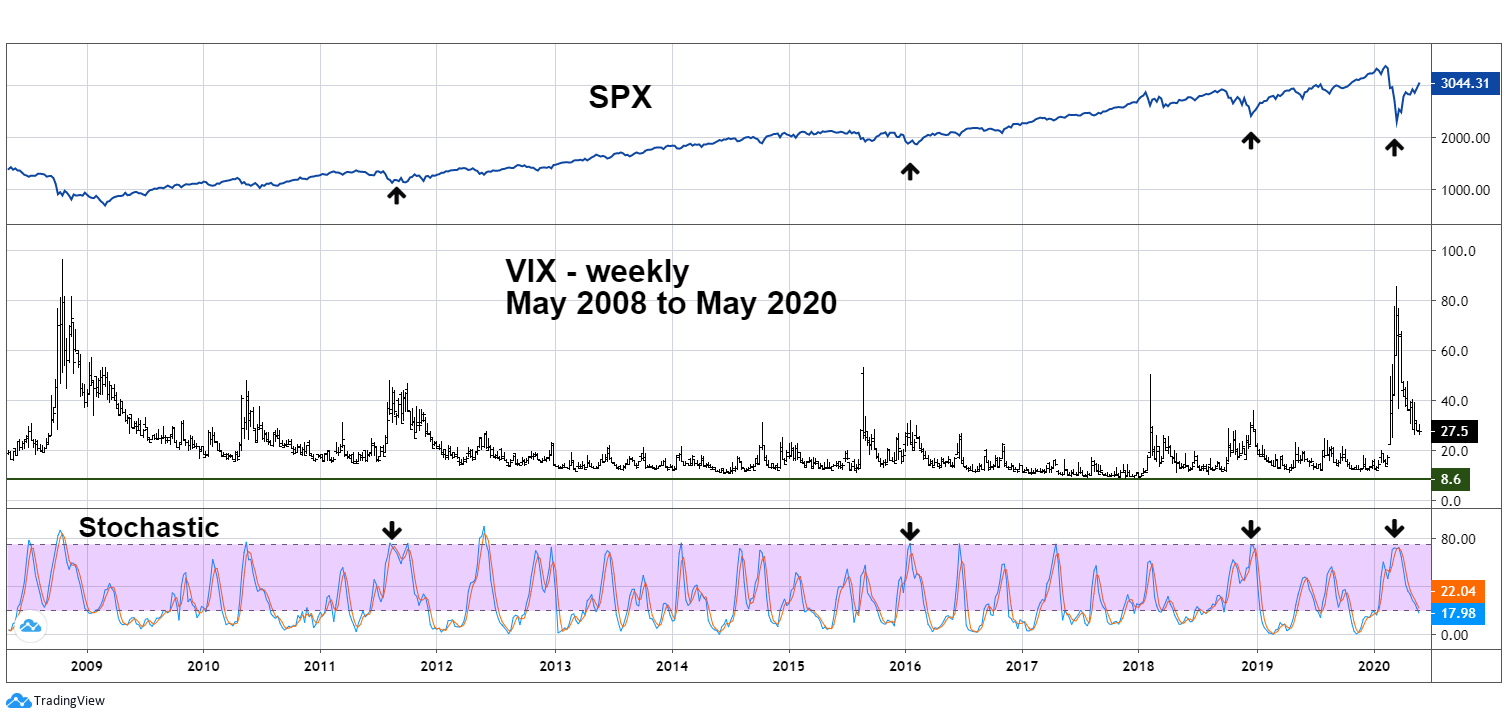
| The CBOE Volatility Index (VIX), sometimes referred to as the fear index, is highly effective indicating significant stock market bottoms. When used in conjunction with market support levels and other technical indicators, it's possible to discover the exact day of important bottoms. VIX is not useful in finding exact market tops. A study of VIX's history reveals how it transitions from bull to bear markets VIX - Weekly Using technical indicators on the VIX are helpful in discovering when a market bottom could be forming. Bollinger bands on the VIX are effective when VIX has large spikes above the upper band. Stochastic is another useful tool. Please see the weekly VIX and S&P 500 (SPX) chart illustrated in Figure 1. The default Stochastic overbought level is 80%. Adjusting the level to 75% reveals the area where the weekly SPX could be at, or near, an important bottom. These types of readings usually occur about once a year and if the SPX is near chart and/or Fibonacci support, probabilities of an SPX bottom are high. |
|
| Figure 1. These types of readings usually occur about once a year. |
| Graphic provided by: tradingview.com. |
| |
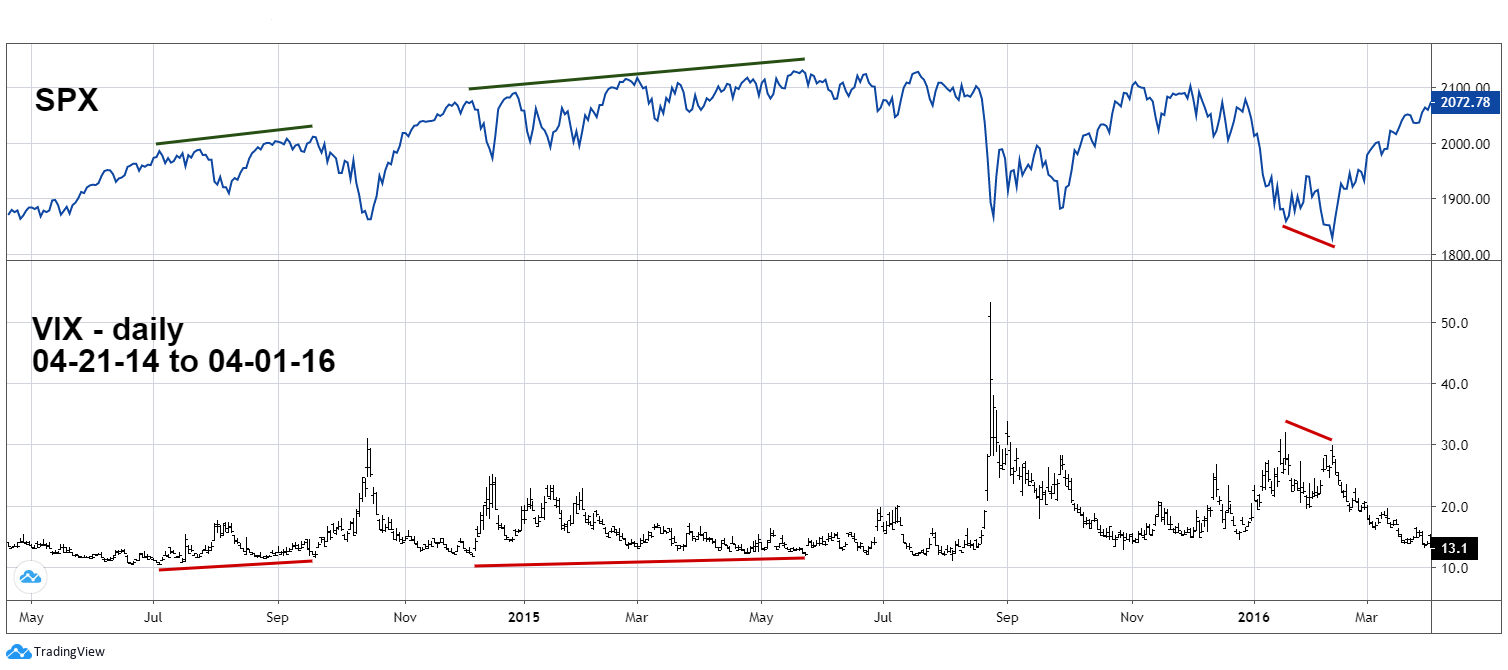
| VIX - Daily After a VIX spike/SPX bottom, the VIX will trend down over a period of several months until it reaches the range of about 15 to 9. Please see the daily VIX and SPX chart illustrated in Figure 2. After reaching the bottom range VIX will meander sideways and, at some point, reach its ultimate low for that cycle. Since about 2012 this ultimate low has been around 9 to 11. The ultimate VIX cycle bottom does not correspond to a significant SPX top. Note that from late 2014 to mid-2015 this process took about six months and required two higher VIX bottoms before the SPX peaked. Sometimes it requires several VIX higher bottoms before the SPX can reach its ultimate bull-phase high. Used by itself, the VIX is not an effective tool in timing SPX tops. You usually need evidence from all four market dimensions — price, time, sentiment, and momentum — to discover stock market tops. Fibonacci price resistance zones in conjunction with bearish momentum divergences occurring late in a bullish season are effective in narrowing the zone of potential significant stock market tops. A VIX bottom followed by diverging VIX lows gives you an indication of an approaching stock market top. Unfortunately, sometimes it's an extremely broad zone. |
|
| Figure 2. Used by itself the VIX is not an effective tool in timing SPX tops. |
| Graphic provided by: tradingview.com. |
| |
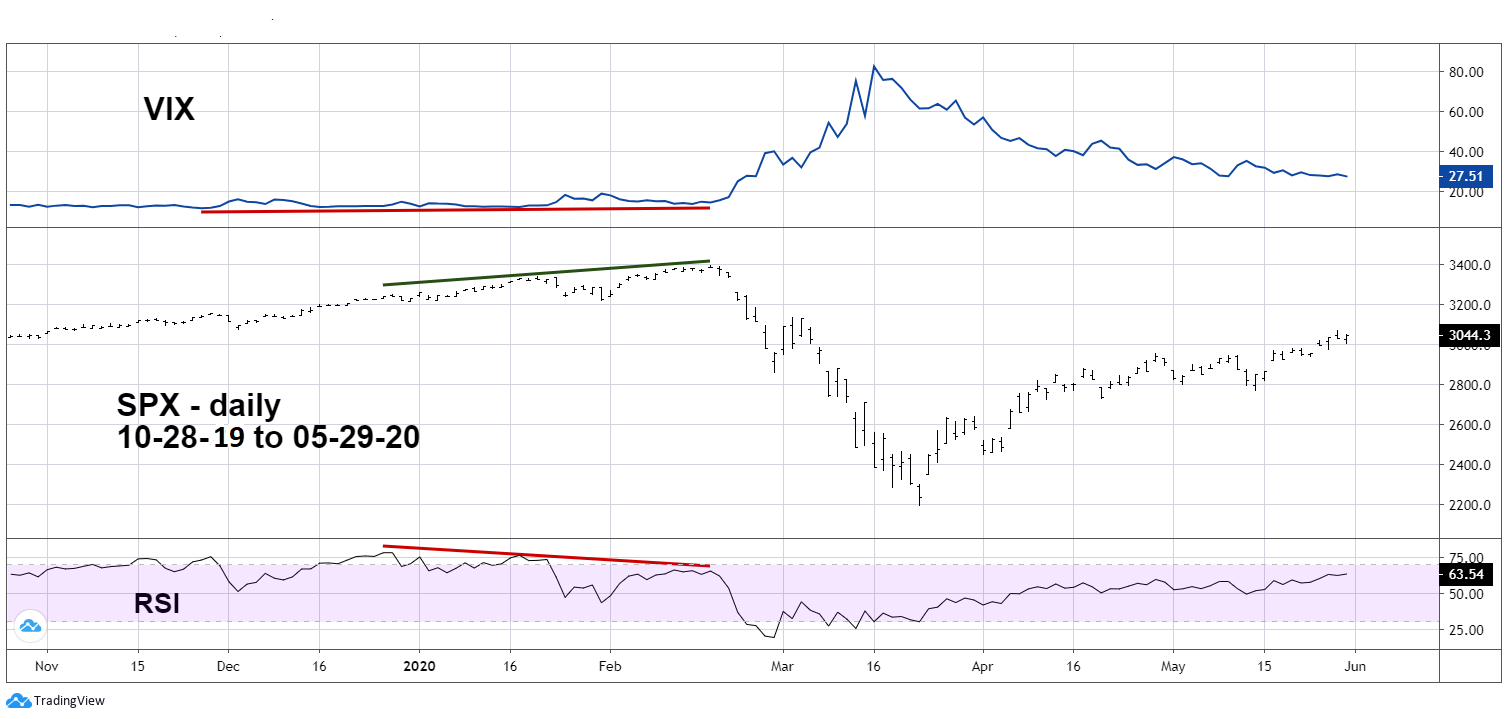
| SPX and VIX - Current Cycle Please see the daily 2019 to 2020 SPX and VIX chart illustrated in Figure 3. As of the end of May 2020 VIX had declined from its late March spike high and had reached the level of 27.51. Think of the VIX as a bullish fuel gauge. There's a high probability the VIX could continue to decline and then base with divergences off the ultimate bottom. The process could take several months corresponding with an ongoing stock bull market. Backing up the VIX evidence is the daily SPX RSI. Its late May reading was only 63%; normally, with stocks the RSI will go into the overbought zone followed by at least one bearish divergence before a significant stock top is in place. The combined daily VIX and RSI late-May signals hint the SPX could reach the next significant resistance zone — 3300 to 3393 — by at least August 2020. |
|
| Figure 3. There�s a high probability the VIX could continue to decline. |
| Graphic provided by: tradingview.com. |
| |
| Relentless Stock Market Rally Since the March 23, 2020 bottom the US stock market has been in an immensely powerful rally and could still continue climbing higher. From the post-crash rally high made on May 28, the SPX has rallied 40% off the crash bottom and has retraced more than 72% of the February to March decline. My May 29 article "Elliott Wave Crossroads - Part Two" noted the SPX could be in an Expanding Flat correction and that near-term resistance was at SPX 3000. If this resistance held the SPX could then decline to the upper 2600 area. The SPX easily went above 3000 and the Expanding Flat is now an exceptionally low probability. The SPX has rallied significantly above the Fibonacci .618 retrace of the February to March decline — a bullish sign. After a brief shallow April to March correction the SPX has rallied during a seasonally bearish time — another bullish sign. Daily RSI and VIX as of late May are not at levels that suggest a significant top could be in place — also bullish. These factors strongly imply higher SPX prices for at least several weeks, perhaps months. Don't fight the trend. Yes, economic fundamentals from the virus crisis are still bearish. Markets look ahead and forecast fundamentals. By the time you see an improving economy, most of a stock rally could be complete. Further Reading: Neill B. Humphrey (1985) "The Art of Contrary Thinking" The Caxton Printers. |
Independent investment advisor, trader and writer. He has written articles for Technical Analysis of Stocks & Commodities, Traders.com Advantage,Futuresmag.com and, Finance Magnates. Author of website Four Dimension Trading.
| Website: | www.fourdimensiontrading.com |
| E-mail address: | markrivest@gmail.com |
Click here for more information about our publications!
PRINT THIS ARTICLE

Request Information From Our Sponsors
- StockCharts.com, Inc.
- Candle Patterns
- Candlestick Charting Explained
- Intermarket Technical Analysis
- John Murphy on Chart Analysis
- John Murphy's Chart Pattern Recognition
- John Murphy's Market Message
- MurphyExplainsMarketAnalysis-Intermarket Analysis
- MurphyExplainsMarketAnalysis-Visual Analysis
- StockCharts.com
- Technical Analysis of the Financial Markets
- The Visual Investor
- VectorVest, Inc.
- Executive Premier Workshop
- One-Day Options Course
- OptionsPro
- Retirement Income Workshop
- Sure-Fire Trading Systems (VectorVest, Inc.)
- Trading as a Business Workshop
- VectorVest 7 EOD
- VectorVest 7 RealTime/IntraDay
- VectorVest AutoTester
- VectorVest Educational Services
- VectorVest OnLine
- VectorVest Options Analyzer
- VectorVest ProGraphics v6.0
- VectorVest ProTrader 7
- VectorVest RealTime Derby Tool
- VectorVest Simulator
- VectorVest Variator
- VectorVest Watchdog