

HOT TOPICS LIST
- MACD
- Fibonacci
- RSI
- Gann
- ADXR
- Stochastics
- Volume
- Triangles
- Futures
- Cycles
- Volatility
- ZIGZAG
- MESA
- Retracement
- Aroon
INDICATORS LIST
LIST OF TOPICS
PRINT THIS ARTICLE
by Stella Osoba, CMT
Blue Chips are large multinational companies with sound balance sheets and sounder reputations. They have been in their industry for a considerable amount of time and ownership of their shares are generally regarded as safe investments. They are usually able to weather economic downturns with their superior balance sheets. Many of the companies that are in the Dow Jones Industrial Average are regarded as blue chips. Let's take a look at the price behavior of Walt Disney Co. (DIS) and see how this entertainment behemoth has weathered the economic shutdown caused by the pandemic known as COVID-19.
Position: N/A
Stella Osoba, CMT
Stella Osoba is a trader and financial writer. She is a frequent contributor to "Technical Analysis of Stocks and Commodities" magazine and "Traders.com Advantage" as well as other financial publications.
PRINT THIS ARTICLE
TECHNICAL ANALYSIS
Are There Any Blue Chips Left?
05/01/20 05:53:55 PMby Stella Osoba, CMT
Blue Chips are large multinational companies with sound balance sheets and sounder reputations. They have been in their industry for a considerable amount of time and ownership of their shares are generally regarded as safe investments. They are usually able to weather economic downturns with their superior balance sheets. Many of the companies that are in the Dow Jones Industrial Average are regarded as blue chips. Let's take a look at the price behavior of Walt Disney Co. (DIS) and see how this entertainment behemoth has weathered the economic shutdown caused by the pandemic known as COVID-19.
Position: N/A
| DIS recently caused outrage when it announced that it would stop paying the salaries of 100,000 of its employees, urging them instead to rely on tax payers by taking advantage of unemployment payments and the extra $600 a week of federal support. The savings of $500 million a month DIS will get may end up being more costly in the long run than the reputational damage to the company's image, especially as it appears that it will protect executive bonus schemes which can net said executives millions of dollars each in added compensation per year. |
|
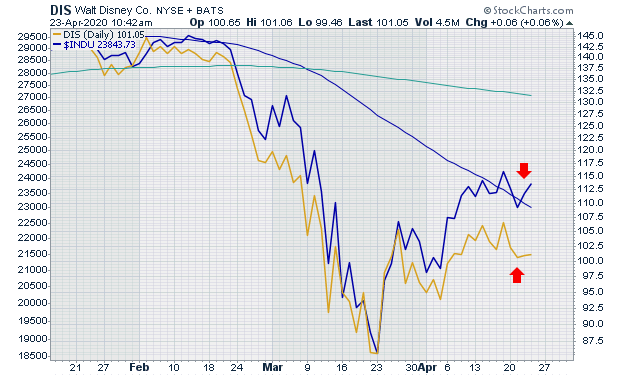
| Figure 1. Daily chart for DIS vs. DJIA. |
| Graphic provided by: StockCharts.com. |
| |
| The technicals show that DIS is performing worse than the index of which it is a component: the Dow Jones Industrial Average. Figure one is a line chart of DIS (Gold line) superimposed over a line chart of the DOW (Blue line). While for most of the period shown in the chart the two lines tracked each other pretty closely, in the last month the divergence between the two has been more significant with the price of the DOW rising while that of DIS is falling to flat (See red arrows on chart). |
|
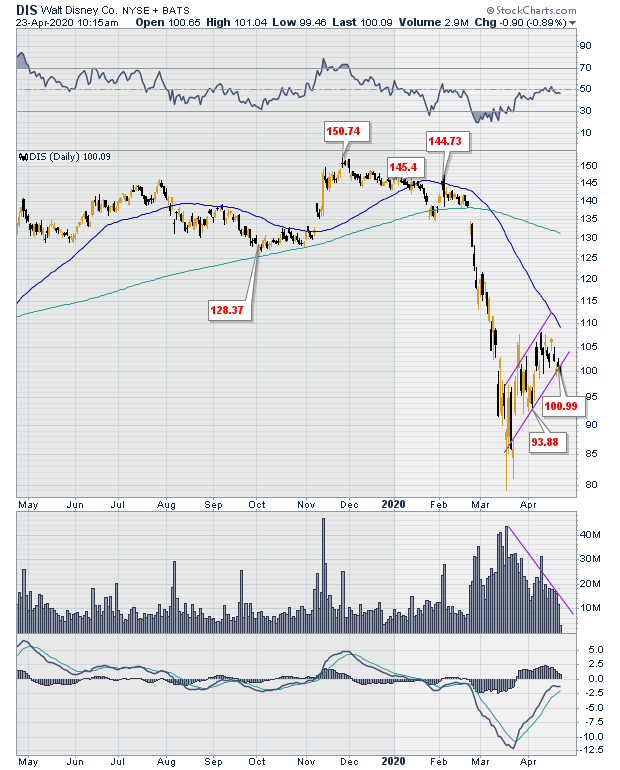
| Figure 2. Upward trend channel on DIS daily chart. |
| Graphic provided by: StockCharts.com. |
| |
| Figure 2 is a daily chart of DIS. Shares of DIS closed at a high of $150 in late November 2019, then traded sideways until the economic downturn caused by the pandemic resulted in a steep slide in its shares from late February 2020 into March. DIS is currently trading in an upward sloping channel. The breakout from the channel will be key to the short-term performance of the stock. A significant break below the lower trend line might see price retest the lows reached in mid March. A break above the upper channel line might signal a V shaped recovery. But the technicals are not great. The decrease in volume as the channel is forming and price is rising do not point to conviction among buyers. Also, with the two hundred day average trading above the 50 day average, it might be some time before DIS has good news to inspire investors to overlook the taint on the magic kingdom. |
Stella Osoba is a trader and financial writer. She is a frequent contributor to "Technical Analysis of Stocks and Commodities" magazine and "Traders.com Advantage" as well as other financial publications.
| E-mail address: | stellaosoba@gmail.com |
Click here for more information about our publications!
PRINT THIS ARTICLE

Request Information From Our Sponsors
- StockCharts.com, Inc.
- Candle Patterns
- Candlestick Charting Explained
- Intermarket Technical Analysis
- John Murphy on Chart Analysis
- John Murphy's Chart Pattern Recognition
- John Murphy's Market Message
- MurphyExplainsMarketAnalysis-Intermarket Analysis
- MurphyExplainsMarketAnalysis-Visual Analysis
- StockCharts.com
- Technical Analysis of the Financial Markets
- The Visual Investor
- VectorVest, Inc.
- Executive Premier Workshop
- One-Day Options Course
- OptionsPro
- Retirement Income Workshop
- Sure-Fire Trading Systems (VectorVest, Inc.)
- Trading as a Business Workshop
- VectorVest 7 EOD
- VectorVest 7 RealTime/IntraDay
- VectorVest AutoTester
- VectorVest Educational Services
- VectorVest OnLine
- VectorVest Options Analyzer
- VectorVest ProGraphics v6.0
- VectorVest ProTrader 7
- VectorVest RealTime Derby Tool
- VectorVest Simulator
- VectorVest Variator
- VectorVest Watchdog