HOT TOPICS LIST
- MACD
- Fibonacci
- RSI
- Gann
- ADXR
- Stochastics
- Volume
- Triangles
- Futures
- Cycles
- Volatility
- ZIGZAG
- MESA
- Retracement
- Aroon
INDICATORS LIST
LIST OF TOPICS
PRINT THIS ARTICLE
by Mark Rivest
Additional evidence US stocks may have begun a multi-month rally.
Position: N/A
Mark Rivest
Independent investment advisor, trader and writer. He has written articles for Technical Analysis of Stocks & Commodities, Traders.com Advantage,Futuresmag.com and, Finance Magnates. Author of website Four Dimension Trading.
PRINT THIS ARTICLE
ELLIOTT WAVE
The Bull Is Dead, Long Live The Bull - Part Two
04/10/20 03:53:37 PMby Mark Rivest
Additional evidence US stocks may have begun a multi-month rally.
Position: N/A
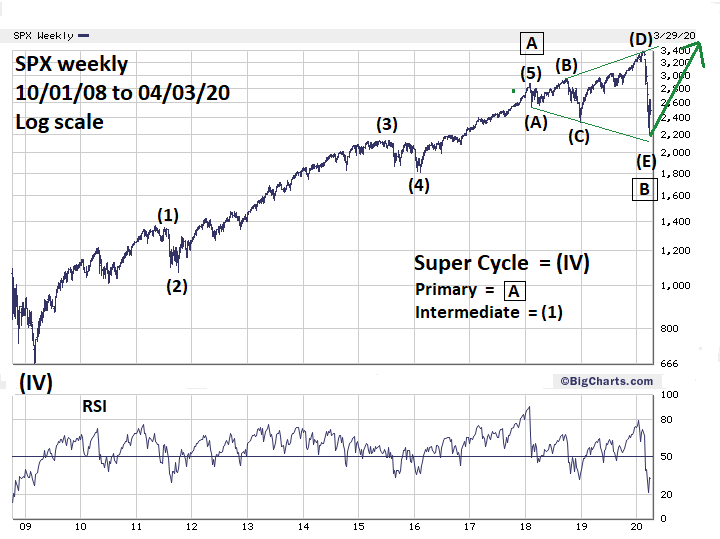
| As of April 3, 2020, the mind-boggling rapid decline in stocks has stopped. Could the crash resume? An alternate Elliott wave count and a closer examination of the S&P 500 (SPX) recent nadir reveal some fascinating bullish clues. S&P 500 - Weekly Sometimes markets can reach the same destination with two different Elliott wave counts. My April 2, 2020 article "The Bull is Dead, Long Live the Bull" noted the SPX destination reached on March 23 was Primary wave "B" bottom of a possible on-going Cycle degree bull market. Please see the weekly SPX chart illustrated in Figure 1. The Elliott wave pattern from the January 2018 peak could be a rare Expanding Horizontal Triangle (EHT). These formations are composed of five overlapping sub waves. Each sub wave further subdivide into three waves or a combination of three waves. In this situation the EHT is correcting the rally from March 2009 to January 2018. The most common Fibonacci relationships are among the alternating sub waves of Horizontal Triangles. The lengths of each sub wave:
(C) 593.30 / (E) 1201.60 = .493, close to a Fibonacci .50 (B) 407.20 / (D) 1046.90 = .388, close to a Fibonacci .382 Both wave (B) and (D) rallies are choppy and count best as three wave movements. Additionally, there's a Fibonacci time ratio. The supposed Primary wave "A"-boxed lasted 464 weeks, Primary wave "B"-boxed was 113 weeks. 113/464 = .243, close to a Fibonacci .236. The Expanding Horizontal Triangle's price and time proportions make it the best Elliott wave interpretation of the SPX progress from March 2009 to March 2020. |

|
| Figure 1. The Elliott wave pattern from the January 2018 peak could be a rare Expanding Horizontal Triangle. |
| Graphic provided by: BigCharts.com. |
| |
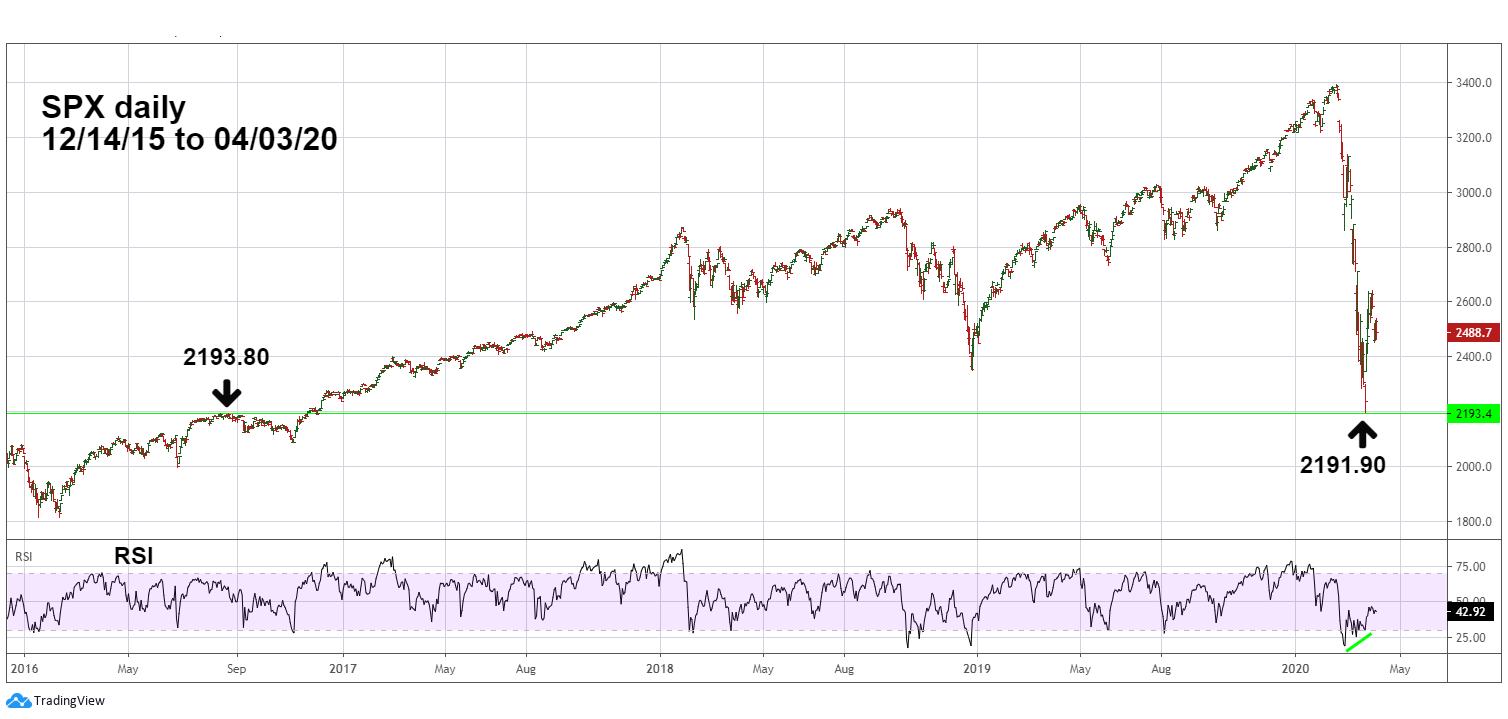
| S&P 500 - Daily Please see the daily SPX chart illustrated in Figure 2. My April 2 article noted the SPX 2020 decline of 35.4% nearly equaled the 35.9% drop of the 1987 bear market. Another amazing aspect of the SPX 2191.90 bottom is that it reached the pinnacle of the mid-2016 broad top. This is a perfect example of prior resistance becoming support. Also note the daily RSI had a double bullish divergence at the March 23 crash bottom. |

|
| Figure 2. This is a perfect example of prior resistance becoming support. |
| Graphic provided by: tradingview.com. |
| |
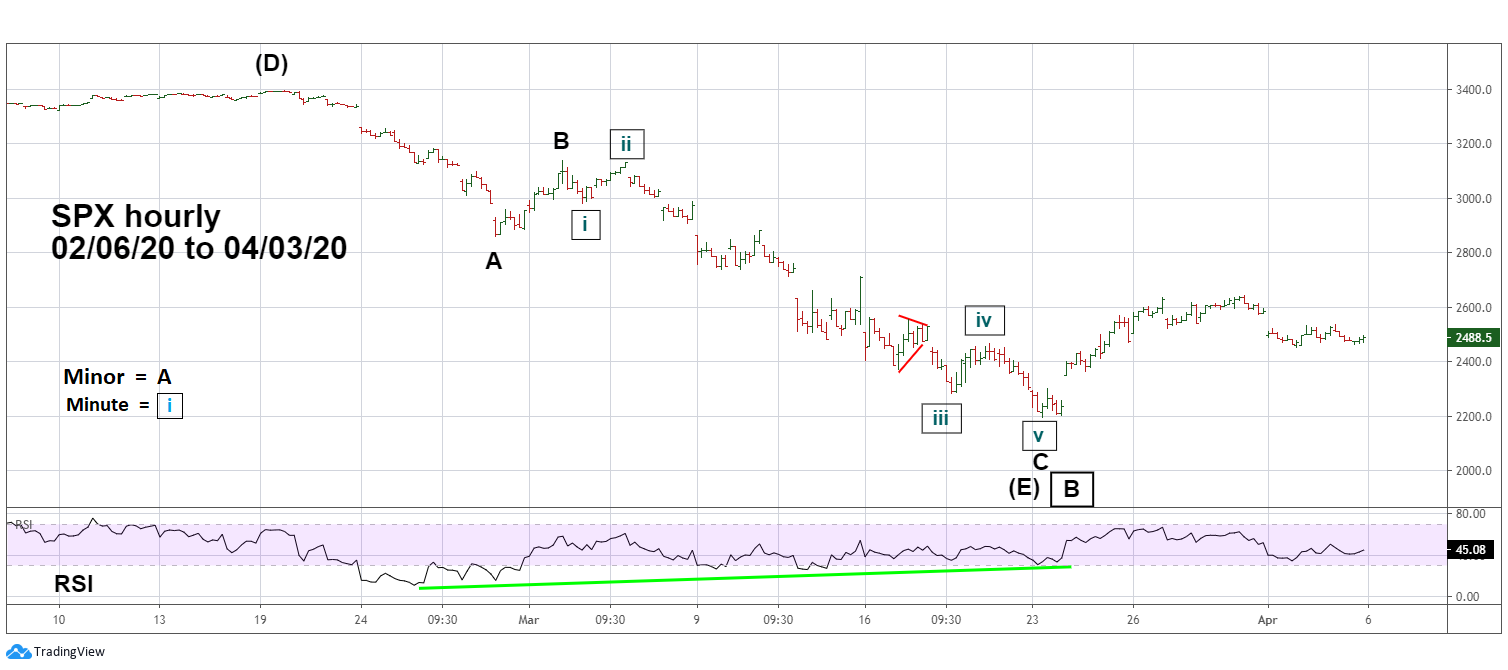
| S&P 500 - Hourly If a multi-year Expanding Horizontal Triangle ended on March 23, the supposed Intermediate wave (E) would have to subdivide in a three waves or a combination of three waves. Please see the hourly SPX chart illustrated in Figure 3. Minor wave "A" and "C" are separated by the largest rally within the February to March decline, making this movement the ideal candidate for Minor wave "B". Within Minor wave "C", Minute wave "I"-boxed is .618 of Minute wave "v"-boxed. Minute waves "ii" and "iv" are near equal in price and time. Minute wave "iii" is the longest and extended, a characteristic of third waves especially in the stock market. An alternate bearish wave count has the supposed Minor wave "A" as Minor wave "1", the supposed Minor wave "C" would be Minor wave "3" of a developing impulse wave down that could exceed the March 23 bottom. As of April 3, the post March 23 rally is just about 1.618 the size of supposed Minor wave "B". This is an appropriate Fibonacci relationship between waves "two" and "four". However, most of the time wave "fours" are equal or smaller than wave "twos". The reason: the mass mind recognizes the primary trend making it difficult for deep counter trend action in the fourth wave position. With the current super bearish fundamentals, you would expect a move up from the March 23 bottom to be quickly hit with heavy selling. The SPX has been able to rally further and longer than the supposed Minor wave "B'" in the face of very bearish news. |

|
| Figure 3. The SPX has been able to rally further and longer than the supposed Minor wave B in the face of very bearish news. |
| Graphic provided by: tradingview.com. |
| |
| Markets And The News Fibonacci price and time relationships within the Expanding Horizontal Triangle, SPX bottoming at the mid 2016 top and nearly equaling the 1987 bear market indicate the March 23 bottom was significant. These combined factors indicate powerful support and could require a powerful down move to break below SPX 2191. With the death toll from the virus rapidly rising, new market lows are within the realm of possibilities. Markets discount the future and as long as the SPX can hold above its late March bottom, it's a hopeful sign that the worst part of the virus crisis could be over soon. Further Reading: Frost A.J and Robert Prechter (1985) "Elliott Wave Principle", New Classics Library. Neill B. Humphrey (1985) "The Art of Contrary Thinking" The Caxton Printers. |
Independent investment advisor, trader and writer. He has written articles for Technical Analysis of Stocks & Commodities, Traders.com Advantage,Futuresmag.com and, Finance Magnates. Author of website Four Dimension Trading.
| Website: | www.fourdimensiontrading.com |
| E-mail address: | markrivest@gmail.com |
Click here for more information about our publications!
PRINT THIS ARTICLE

Request Information From Our Sponsors
- VectorVest, Inc.
- Executive Premier Workshop
- One-Day Options Course
- OptionsPro
- Retirement Income Workshop
- Sure-Fire Trading Systems (VectorVest, Inc.)
- Trading as a Business Workshop
- VectorVest 7 EOD
- VectorVest 7 RealTime/IntraDay
- VectorVest AutoTester
- VectorVest Educational Services
- VectorVest OnLine
- VectorVest Options Analyzer
- VectorVest ProGraphics v6.0
- VectorVest ProTrader 7
- VectorVest RealTime Derby Tool
- VectorVest Simulator
- VectorVest Variator
- VectorVest Watchdog
- StockCharts.com, Inc.
- Candle Patterns
- Candlestick Charting Explained
- Intermarket Technical Analysis
- John Murphy on Chart Analysis
- John Murphy's Chart Pattern Recognition
- John Murphy's Market Message
- MurphyExplainsMarketAnalysis-Intermarket Analysis
- MurphyExplainsMarketAnalysis-Visual Analysis
- StockCharts.com
- Technical Analysis of the Financial Markets
- The Visual Investor
