

HOT TOPICS LIST
- MACD
- Fibonacci
- RSI
- Gann
- ADXR
- Stochastics
- Volume
- Triangles
- Futures
- Cycles
- Volatility
- ZIGZAG
- MESA
- Retracement
- Aroon
INDICATORS LIST
LIST OF TOPICS
PRINT THIS ARTICLE
by Mark Rivest
Examination of bull market rates of ascent.
Position: N/A
Mark Rivest
Independent investment advisor, trader and writer. He has written articles for Technical Analysis of Stocks & Commodities, Traders.com Advantage,Futuresmag.com and, Finance Magnates. Author of website Four Dimension Trading.
PRINT THIS ARTICLE
MOMENTUM
Stock Market Angles
02/13/20 04:29:06 PMby Mark Rivest
Examination of bull market rates of ascent.
Position: N/A
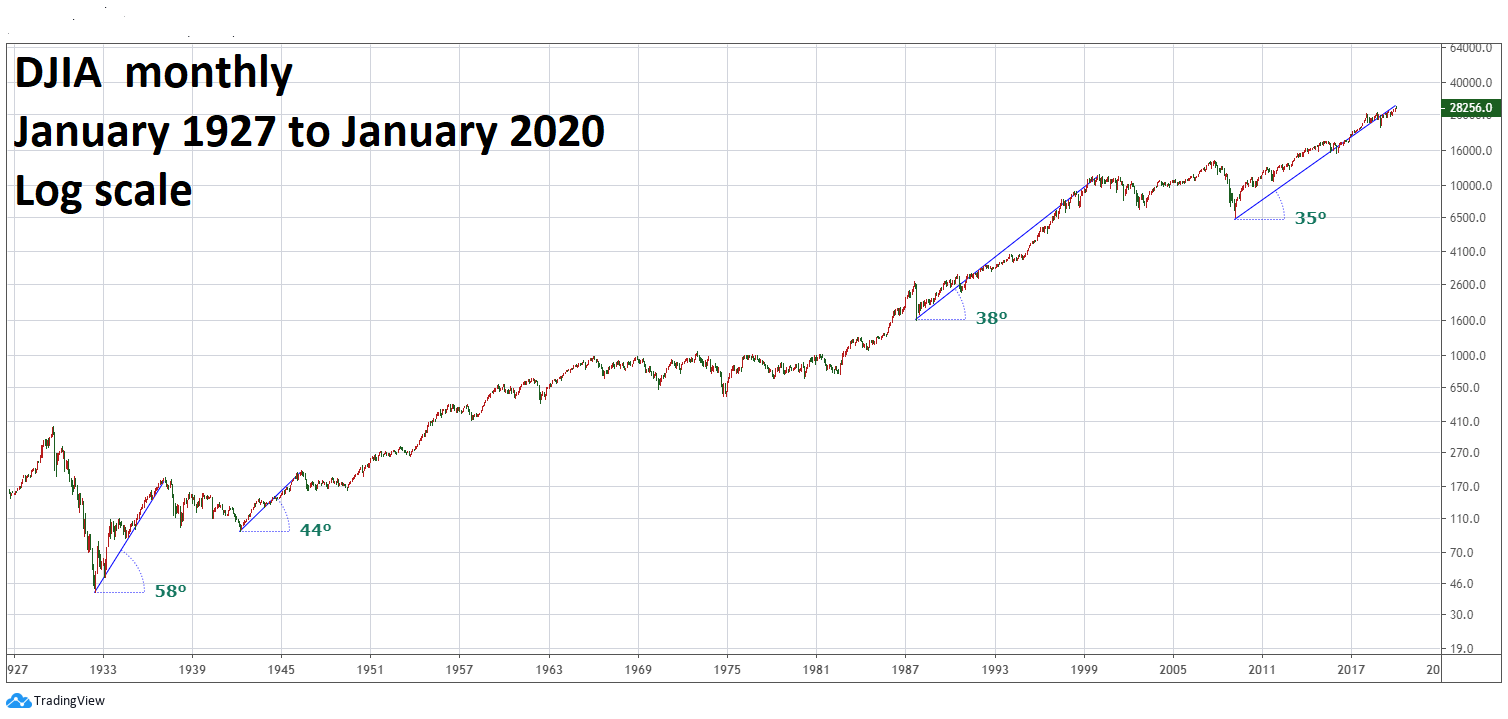
| Some believe that stock bull markets end with powerful parabolic moves up. While this can happen on rare occasions, historical comparisons reveal something else. The big question for market participants: Is a bull market at the beginning, middle or the end? Knowledge of bull market angles can help answer that question. Long-Term Perspective When analyzing market angles use logarithmic scale charts, as you need consistency when making comparisons. A movement from 10 to 15 is not the same as a movement from 110 to 115. A case could be made that a gigantic secular bull market in US stocks began in July 1932, the bottom of the most significant bear market in US history. Please see the Dow Jones Industrial Average (DJIA) chart illustrated in Figure 1. The first step in angle analysis is to examine the sub sections of the larger bullish move. In this case, the first segment began July 1932 and ended March 1937. The steepest angles of ascent are almost always in the first phase of a bullish movement. These steep moves come after periods when stocks are deeply discounted from the prior bear movement. These bull market kick offs are usually treated with skepticism by the crowd, which believes the rise is just another bear market rally. The DJIA went into a five-year bear market after its peak made in March 1937. The next bull market began in April 1942 and lasted until May 1946. Note the angle of ascent of this second bull market is significantly less than the first bull market. In general, as a bull phase ages the rate of ascent decreases. The bull market from October 1987 to January 2000 had an angle of 38 degrees as compared to the 35 degrees of current bull market that commenced in March 2009. |
|
| Figure 1. Note the angle of ascent of this second bull market is significantly less than the first bull market. |
| Graphic provided by: tradingview.com. |
| |
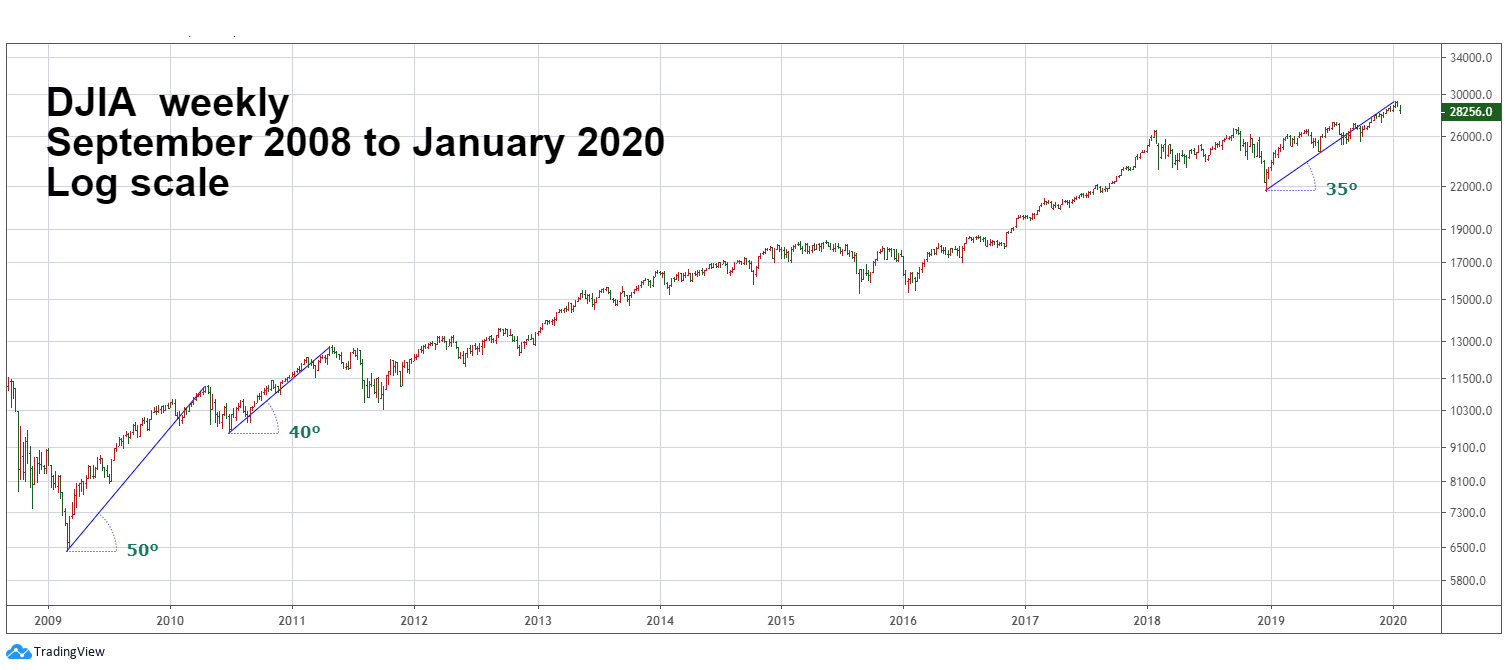
| Intermediate-Term Perspective Please see the weekly DJIA chart illustrated in Figure 2. The kickoff rally of the current bull market went from March 2009 to April 2010 and again has a steeper angle than the subsequent rally 2010 to 2011. The current up-wave that began late 2018 has, so far, a shallower rate of ascent than the first two up-waves. Anyone thinking the current bull market phase is a parabolic rise would be sadly mistaken. |
|
| Figure 2. The kickoff rally of the current bull market went from March 2009 to April 2010 and again has a steeper angle than the subsequent rally 2010 to 2011. |
| Graphic provided by: tradingview.com. |
| |
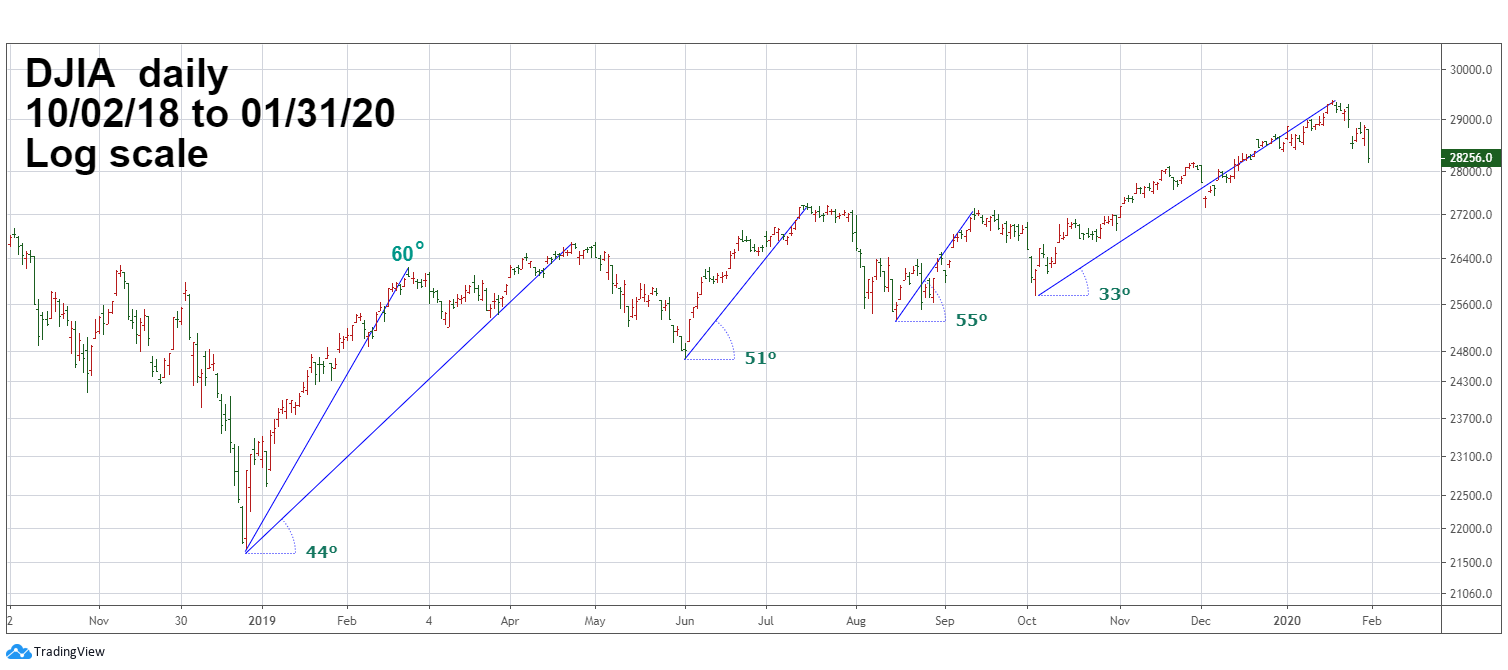
| Short-Term Perspective Please see the daily DJIA chart illustrated in Figure 3. The evidence for the rally that began in late December 2018 is inconclusive due to the choppy nature of the rally. The first rally phase could be interpreted as ending at the February or April 2019 peaks. My January 30, 2020 article, "Elliott Wave Lesson", noted that the wave formation since late 2018 could be a Double Zigzag. If so, this forecasts a bearish scenario that could bring the DJIA back to the December 2018 bottom. The steady relentless rally that began October 3, 2019 has so far, the shallowest ascent of any rally since late 2018. This shallow advance is typical for the middle portion of a rising Elliot five-wave impulse wave. My January 30 article noted that this was the most likely wave pattern in effect. Does the low angle of ascent mean the DJIA is in the mid portion of an ongoing rally, or a signal of a decline back to the December 2018 low? We could have the answer sometime in early February 2020. If the DJIA declines more than 5% from its January 17 all-time high it could be a clue something more bearish is developing. |
|
| Figure 3. The steady relentless rally that began October 3, 2019 has, so far, the shallowest ascent of any rally since late 2018. |
| Graphic provided by: tradingview.com. |
| |
| Comprehensive Approach The study of market angles is supplemental evidence and should be used with other elements of the four market dimensions: price, momentum. time and sentiment. Most stock bull markets end with a whimper, not with a bang. The exceptions are few and far between; the most recent was the rally in January 2018 which culminated in the February 2018 mini-crash. Prior to then you have to go all the way back to late 1999 and early 2000, when the Nasdaq Composite had a blow-off top. If, in a period of several weeks, a rally angle steepens and the weight of evidence from the four market dimensions is bearish, a dramatic downside reversal could be imminent. Further Reading: Frost A.J and Robert Prechter (1985) "Elliott Wave Principle", New Classics Library. Rivest Mark (2020) "The Sentiment Dimension" Technical Analysis of Stocks & Commodities, Volume 38 February. |
Independent investment advisor, trader and writer. He has written articles for Technical Analysis of Stocks & Commodities, Traders.com Advantage,Futuresmag.com and, Finance Magnates. Author of website Four Dimension Trading.
| Website: | www.fourdimensiontrading.com |
| E-mail address: | markrivest@gmail.com |
Click here for more information about our publications!
PRINT THIS ARTICLE

Request Information From Our Sponsors
- StockCharts.com, Inc.
- Candle Patterns
- Candlestick Charting Explained
- Intermarket Technical Analysis
- John Murphy on Chart Analysis
- John Murphy's Chart Pattern Recognition
- John Murphy's Market Message
- MurphyExplainsMarketAnalysis-Intermarket Analysis
- MurphyExplainsMarketAnalysis-Visual Analysis
- StockCharts.com
- Technical Analysis of the Financial Markets
- The Visual Investor
- VectorVest, Inc.
- Executive Premier Workshop
- One-Day Options Course
- OptionsPro
- Retirement Income Workshop
- Sure-Fire Trading Systems (VectorVest, Inc.)
- Trading as a Business Workshop
- VectorVest 7 EOD
- VectorVest 7 RealTime/IntraDay
- VectorVest AutoTester
- VectorVest Educational Services
- VectorVest OnLine
- VectorVest Options Analyzer
- VectorVest ProGraphics v6.0
- VectorVest ProTrader 7
- VectorVest RealTime Derby Tool
- VectorVest Simulator
- VectorVest Variator
- VectorVest Watchdog