

HOT TOPICS LIST
- MACD
- Fibonacci
- RSI
- Gann
- ADXR
- Stochastics
- Volume
- Triangles
- Futures
- Cycles
- Volatility
- ZIGZAG
- MESA
- Retracement
- Aroon
INDICATORS LIST
LIST OF TOPICS
PRINT THIS ARTICLE
by Matt Blackman
It's been an impressive run for Canadian Internet company Shopify, Inc. But can the stock continue its frenetic pace?
Position: N/A
Matt Blackman
Matt Blackman is a full-time technical and financial writer and trader. He produces corporate and financial newsletters, and assists clients in getting published in the mainstream media. Matt has earned the Chartered Market Technician (CMT) designation. Follow Matt on Twitter at www.twitter.com/RatioTrade
PRINT THIS ARTICLE
MOMENTUM
Can Shopify Continue Defying Gravity?
01/17/20 12:37:13 PMby Matt Blackman
It's been an impressive run for Canadian Internet company Shopify, Inc. But can the stock continue its frenetic pace?
Position: N/A
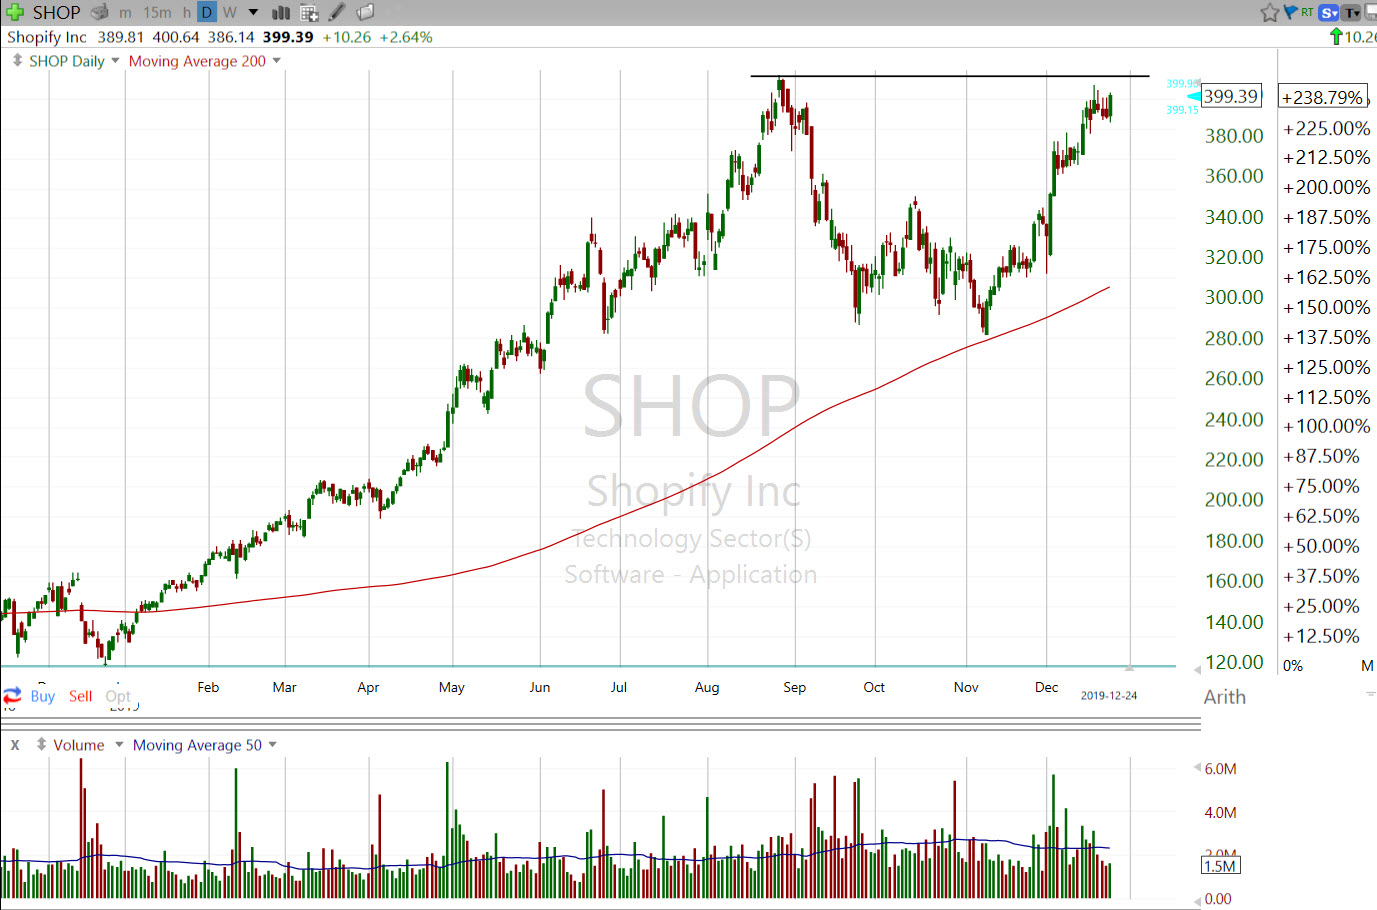
| While running a recent scan for stocks leading the market, software application company Shopify came up at the top of the list. Launched as an Initial Public Offering (IPO) on the Nasdaq on May 21, 2015, it opened at $28. By the last week in August 2019 it had hit a high of $409.61 for a gain of more than 1,500%. And at the stock's current pace, 2019 looks to be its best year yet, boasting a market capitalization of $46 billion as the year came to a close. An online commerce software provider, Shopify is the "one platform to find and sell to the right shoppers, wherever they are" according to the company's website for small and medium Internet businesses in North America, the U.S. and Australia. Online business prices start at $9/month for an account to sell on Facebook and range up to $299/month for advanced store-front website features and services. |
|
| Figure 1. Daily chart of Shopify for 2019 to date showing a better than 200% gain for the year even after a 30% correction in Q3-Q4. |
| Graphic provided by: Freestockcharts.com. |
| |
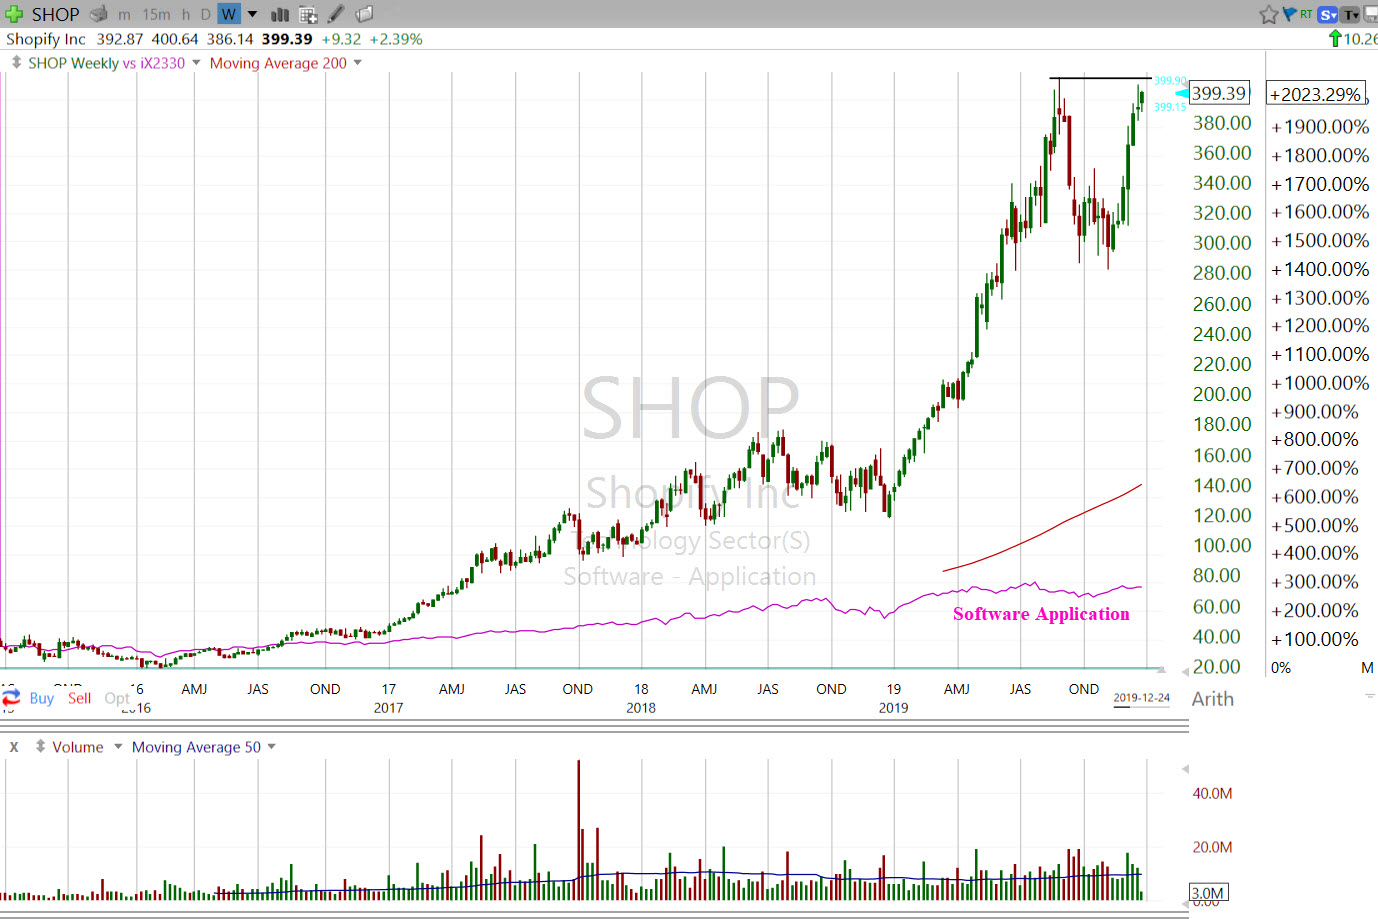
| SHOP had total revenue of 1.073 million for year-end 2018 with a net income loss of $64,553 for a loss of $0.61 per share, down from -$0.42/share in 2017 according to Yahoo Finance. As we see from Figure 2, SHOP fell after its 2015 IPO and it wasn't until June the following year that the stock price finally moved above its $28 opening price and began to march higher. Little more than two years post IPO it broke $100/share. |
|
| Figure 2. Weekly SHOP chart showing its performance since launching on the Nasdaq in 2015 dwarfing that of the Software Application industry (magenta line) over the same period. |
| Graphic provided by: Freestockcharts.com. |
| |
| Technically, $400 looks to be a resistance point for the stock as evidenced by the initial breach in August 2019 followed by a more than 30% correction and recovery into year-end. Whether the stock can finally break and stay above $400 remains to be seen. SHOP has been overbought according to its RSI since late November, so is likely due for some sort of correction as part of the base building process, especially given its recent meteoric rise, if it is to continue moving higher from here. |
| Suggested Reading: A Stock To Keep An Eye On |
Matt Blackman is a full-time technical and financial writer and trader. He produces corporate and financial newsletters, and assists clients in getting published in the mainstream media. Matt has earned the Chartered Market Technician (CMT) designation. Follow Matt on Twitter at www.twitter.com/RatioTrade
| Title: | Author |
| Company: | TradeSystemGuru |
| Address: | Box 2589 |
| Garibaldi Highlands, BC V0N1T0 | |
| Phone # for sales: | 6048989069 |
| E-mail address: | indextradermb@gmail.com |
Traders' Resource Links | |
| TradeSystemGuru has not added any product or service information to TRADERS' RESOURCE. | |
Click here for more information about our publications!
PRINT THIS ARTICLE

Request Information From Our Sponsors
- VectorVest, Inc.
- Executive Premier Workshop
- One-Day Options Course
- OptionsPro
- Retirement Income Workshop
- Sure-Fire Trading Systems (VectorVest, Inc.)
- Trading as a Business Workshop
- VectorVest 7 EOD
- VectorVest 7 RealTime/IntraDay
- VectorVest AutoTester
- VectorVest Educational Services
- VectorVest OnLine
- VectorVest Options Analyzer
- VectorVest ProGraphics v6.0
- VectorVest ProTrader 7
- VectorVest RealTime Derby Tool
- VectorVest Simulator
- VectorVest Variator
- VectorVest Watchdog
- StockCharts.com, Inc.
- Candle Patterns
- Candlestick Charting Explained
- Intermarket Technical Analysis
- John Murphy on Chart Analysis
- John Murphy's Chart Pattern Recognition
- John Murphy's Market Message
- MurphyExplainsMarketAnalysis-Intermarket Analysis
- MurphyExplainsMarketAnalysis-Visual Analysis
- StockCharts.com
- Technical Analysis of the Financial Markets
- The Visual Investor