HOT TOPICS LIST
- MACD
- Fibonacci
- RSI
- Gann
- ADXR
- Stochastics
- Volume
- Triangles
- Futures
- Cycles
- Volatility
- ZIGZAG
- MESA
- Retracement
- Aroon
INDICATORS LIST
LIST OF TOPICS
PRINT THIS ARTICLE
by Koos van der Merwe
Shopify empowers entrepreneurs from all over the world.
Position: Accumulate
Koos van der Merwe
Has been a technical analyst since 1969, and has worked as a futures and options trader with First Financial Futures in Johannesburg, South Africa.
PRINT THIS ARTICLE
TECHNICAL ANALYSIS
A Stock To Keep An Eye On
02/08/18 03:22:54 PMby Koos van der Merwe
Shopify empowers entrepreneurs from all over the world.
Position: Accumulate
| The heading, when one looks for who or what Shopify is on the internet, is "CREATE YOUR ECOMMERCE STORE WITH SHOPIFY." So what is Shopify? What do they do? Shopify is an ecommerce platform allowing a person to sell online, on social media, in-store or even out the trunk of your car. With Shopify's ecommerce software, a seller will receive one unified platform to run their business. The company handles everything from marketing and payments, to secure checkout and shipping. For those people who have manufactured a product, rather than look for stores to sell their product, Shopify offers the ability to market and sell the product all over the world. Their website can be found here. The share is listed on the Canadian stock market under the ticker SHOP. |

|
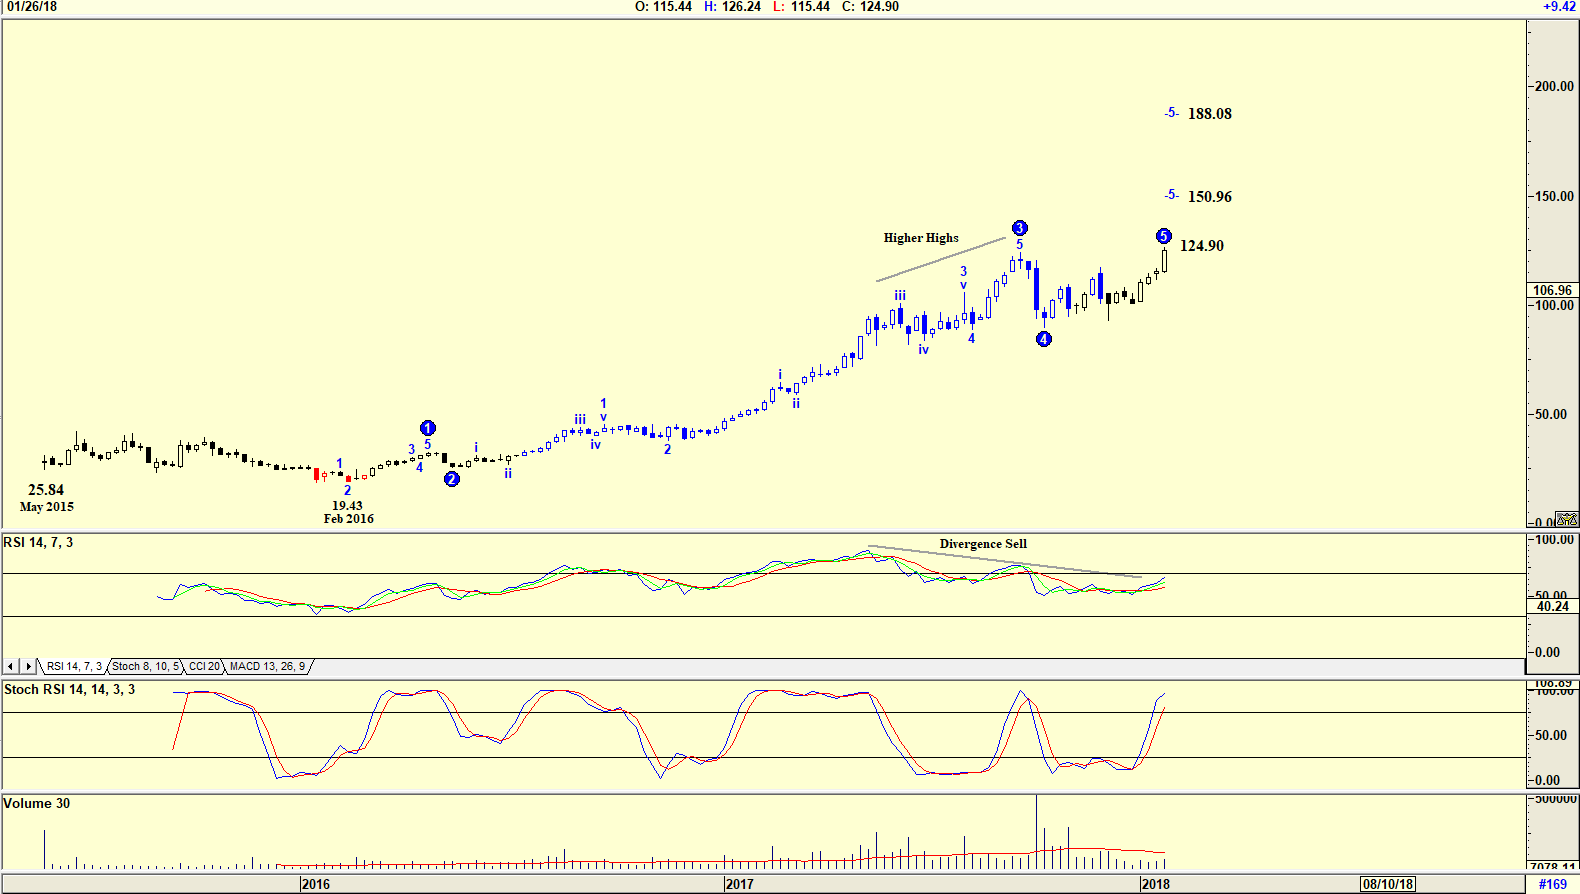
| Figure 1. Weekly chart. |
| Graphic provided by: AdvancedGET. |
| |
| The chart in Figure 1 is a weekly chart showing how the price has risen from a low of $25.84 in May 2015 to its present high of $124.90. The Elliott wave count shown on the chart suggests that the share price is tracing a WAVE 5 that could rise to $150.96 or $188.08 before correcting. The RSI indicator shown on the chart has given a divergence sell signal. A divergence sell signal is given when the RSI indicator traces lower highs while the share price traces higher highs. The Stochastic RSI indicator is presently at overbought levels but has not yet suggested a sell. The share price could rise to either of the two Wave 5 highs suggested on the chart. |

|
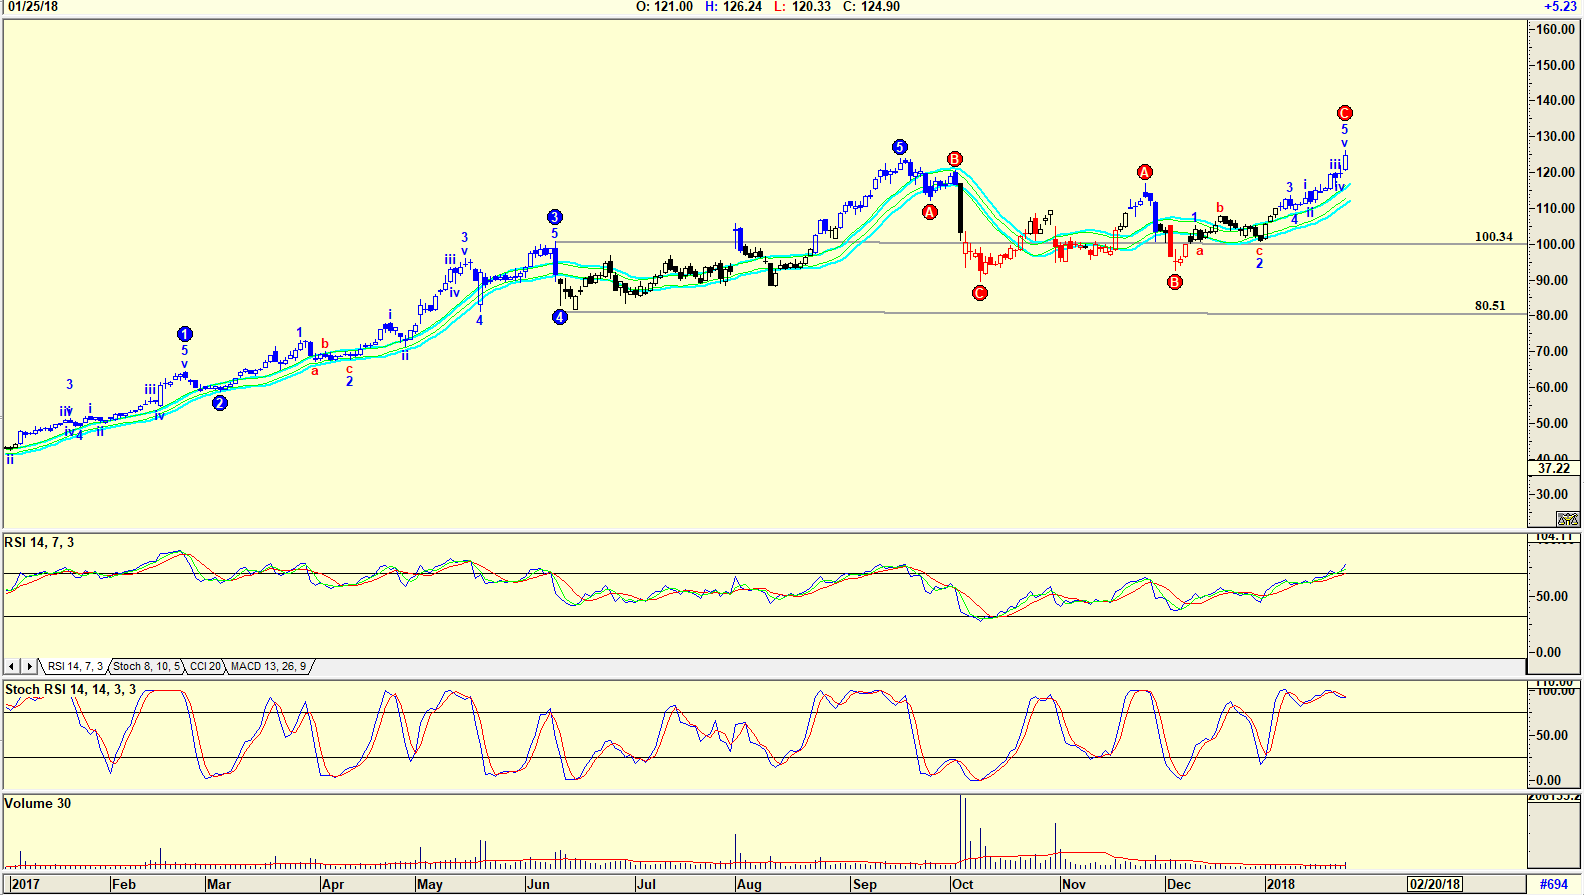
| Figure 2. Daily chart. |
| Graphic provided by: AdvancedGET. |
| |
| The chart in Figure 2 is a daily chart with an Elliott wave count suggesting that the share price is presently tracing an ABC correction in a rising WAVE B. This will be followed by a WAVE C fall to somewhere between $100.34 and $80.51, the Wave 4 correction. With the RSI and Stochastic RSI indicators both at overbought levels, this could happen in the near future, offering a buy opportunity as the share price bottoms. Shopify is an interesting business, and its success as more and more "home" manufacturers look to sell their products throughout the world is worth watching. Yes, the company does charge for its services, and as more and more people throughout the world come to know the company, their share price should continue rising. As one financial advisor of the Business News Network has said, "This is another Amazon." |
Has been a technical analyst since 1969, and has worked as a futures and options trader with First Financial Futures in Johannesburg, South Africa.
| Address: | 3256 West 24th Ave |
| Vancouver, BC | |
| Phone # for sales: | 6042634214 |
| E-mail address: | petroosp@gmail.com |
Click here for more information about our publications!
PRINT THIS ARTICLE

Request Information From Our Sponsors
- StockCharts.com, Inc.
- Candle Patterns
- Candlestick Charting Explained
- Intermarket Technical Analysis
- John Murphy on Chart Analysis
- John Murphy's Chart Pattern Recognition
- John Murphy's Market Message
- MurphyExplainsMarketAnalysis-Intermarket Analysis
- MurphyExplainsMarketAnalysis-Visual Analysis
- StockCharts.com
- Technical Analysis of the Financial Markets
- The Visual Investor
- VectorVest, Inc.
- Executive Premier Workshop
- One-Day Options Course
- OptionsPro
- Retirement Income Workshop
- Sure-Fire Trading Systems (VectorVest, Inc.)
- Trading as a Business Workshop
- VectorVest 7 EOD
- VectorVest 7 RealTime/IntraDay
- VectorVest AutoTester
- VectorVest Educational Services
- VectorVest OnLine
- VectorVest Options Analyzer
- VectorVest ProGraphics v6.0
- VectorVest ProTrader 7
- VectorVest RealTime Derby Tool
- VectorVest Simulator
- VectorVest Variator
- VectorVest Watchdog
