HOT TOPICS LIST
- MACD
- Fibonacci
- RSI
- Gann
- ADXR
- Stochastics
- Volume
- Triangles
- Futures
- Cycles
- Volatility
- ZIGZAG
- MESA
- Retracement
- Aroon
INDICATORS LIST
LIST OF TOPICS
PRINT THIS ARTICLE
by Andrew Hetherington
I suggest selling into the breakouts of this stock while others are chasing them higher or lower, and buy or sell once again on the throwbacks and pullbacks.
Position: N/A
Andrew Hetherington
Classic Dow Theorist who trades as a pure technician, using pattern recognition.
PRINT THIS ARTICLE
CHART ANALYSIS
JP Morgan is Chasing Higher
12/31/02 11:01:40 AMby Andrew Hetherington
I suggest selling into the breakouts of this stock while others are chasing them higher or lower, and buy or sell once again on the throwbacks and pullbacks.
Position: N/A
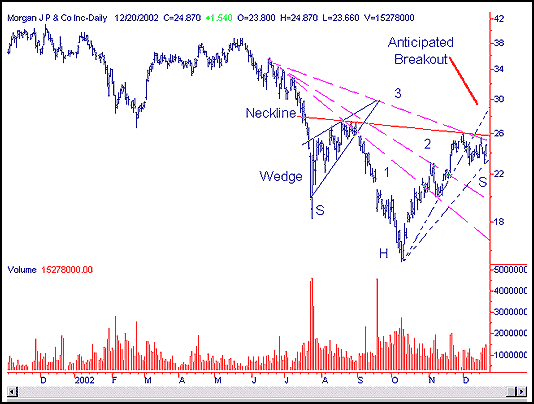
 Figure 1: JP Morgan's daily chart. JP Morgan's (JPM) daily chart shows a head and shoulders pattern that is not quite complete. Although caution must be used when trading within the pattern, this type of opportunity can be profitable if traded with a stop-loss along the second fan line (orginating from the head), currently in the $23.20 area. This line slopes upwards so the price will change as time goes on. The stop-loss allows you to protect your downside risk without having to constantly monitor your investments. I also recommend having a predetermined sell order placed when the equity is rising. I use the first fan line in conjunction with horizontal resistance lines to determine a sell point, which would be near the $29.00 area currently. Once again, this line slopes upwards and will change over time. The anticipated breakout will eventually stop and have the customary throwback to the neckline. My suggestion is to sell into the strength of the breakout and buy long on the throwback as a good strategy to accumulate more shares. This is the same technique I suggest when shorting, but in reverse. I suggest selling into breakouts while others are chasing them higher or lower and buy or sell once again on the throwbacks and pullbacks. You don't always get the squeeze you are looking for but by and large this will place you further ahead. |
| The neckline is in the $25.80 area and if the volume continues to increase, then it should break out. The increase in volume is of paramount importance in this type of situation. If the activity does not continue to increase then the breakout and ascent in price becomes less dependable. In this scenario, rising prices and lower volume, selling at any profit would be a wise choice since a turnaround could happen at any time. |

|
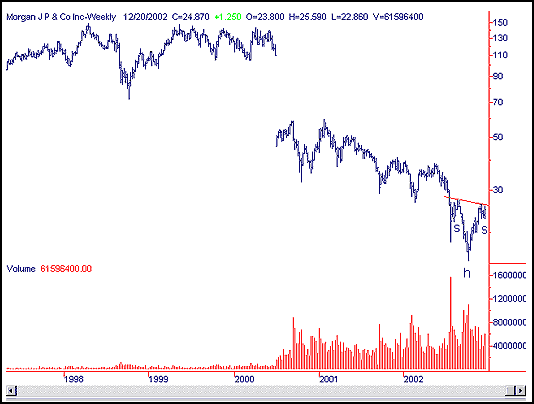
| Figure 2: JP Morgan's weekly chart. |
| Graphic provided by: SuperCharts. |
| |
| An early warning to watch for is when the third fan line is broken in the $25.20 area. Naturally, this must also have increased activity to be reliable. This head and shoulders pattern like so many others during this time frame has high volume at the base of the head. Similar to Alcoa, there was technical buying on the long-term support. |
Classic Dow Theorist who trades as a pure technician, using pattern recognition.
| Toronto, Canada |
Click here for more information about our publications!
Comments

Request Information From Our Sponsors
- StockCharts.com, Inc.
- Candle Patterns
- Candlestick Charting Explained
- Intermarket Technical Analysis
- John Murphy on Chart Analysis
- John Murphy's Chart Pattern Recognition
- John Murphy's Market Message
- MurphyExplainsMarketAnalysis-Intermarket Analysis
- MurphyExplainsMarketAnalysis-Visual Analysis
- StockCharts.com
- Technical Analysis of the Financial Markets
- The Visual Investor
- VectorVest, Inc.
- Executive Premier Workshop
- One-Day Options Course
- OptionsPro
- Retirement Income Workshop
- Sure-Fire Trading Systems (VectorVest, Inc.)
- Trading as a Business Workshop
- VectorVest 7 EOD
- VectorVest 7 RealTime/IntraDay
- VectorVest AutoTester
- VectorVest Educational Services
- VectorVest OnLine
- VectorVest Options Analyzer
- VectorVest ProGraphics v6.0
- VectorVest ProTrader 7
- VectorVest RealTime Derby Tool
- VectorVest Simulator
- VectorVest Variator
- VectorVest Watchdog
