HOT TOPICS LIST
- MACD
- Fibonacci
- RSI
- Gann
- ADXR
- Stochastics
- Volume
- Triangles
- Futures
- Cycles
- Volatility
- ZIGZAG
- MESA
- Retracement
- Aroon
INDICATORS LIST
LIST OF TOPICS
PRINT THIS ARTICLE
by Andrew Hetherington
The daily chart of Alcoa shows a much brighter future in the near-term.
Position: N/A
Andrew Hetherington
Classic Dow Theorist who trades as a pure technician, using pattern recognition.
PRINT THIS ARTICLE
CHART ANALYSIS
A Breakout for Alcoa?
12/30/02 08:26:54 AMby Andrew Hetherington
The daily chart of Alcoa shows a much brighter future in the near-term.
Position: N/A
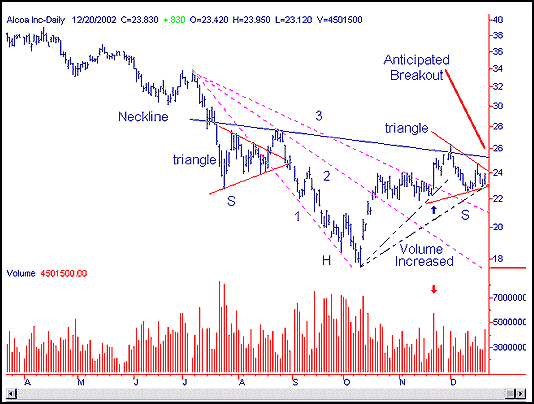
 Figure 1: Daily chart of Alcoa, Inc. In my July 2002 article on Alcoa (AA) I illustrated the power of the third fan line break in conjunction with rectangle and triangle formations. I called for a drop over time to a minimum of $25.00 from the $34.00 area. Naturally, that was a minimum suggestion and it dropped as low as $17.62 in October. This example identifies the importance of playing with the general trend. If the trend of the Dow is up, then trade long, and if it is down then trade short. When the Dow dropped hard to 7177 almost everything else dropped with it regardless of sector or industry. Of course, there is always one or two that buck the trend, but generally speaking it is much safer to trade with the trend. The most difficult aspect is to identify the direction of the current trend. Currently, I am anticipating a rise up towards the 9500 area. |
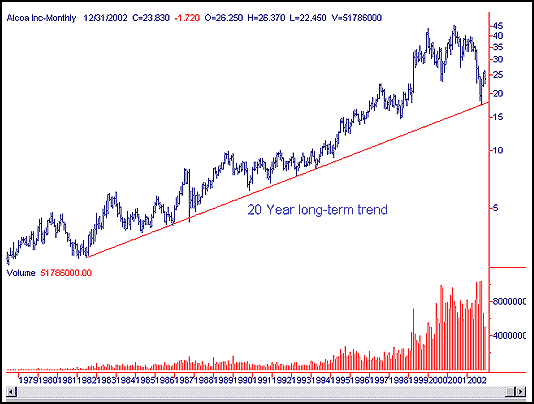
| On this daily chart of Alcoa I see a much brighter future in the near-term. We have a 6-month head and shoulders pattern with heavy volume at the bottom of the head. Normally, I prefer to see the head and shoulders pattern with very minimal volume at the base of the head. However, in this chart the long-term 20-22 year trend must be considered. This trend intersected with the head and thus created heavy demand. This type of demand was technical buying. Many houses on Wall Street and fund managers saw this line and took the risk. It was worth the risk since Alcoa was such a dependable equity they could count on the bounce in the $17.00 - $20.00 area. It had dropped from the $40.00 area in a six-month period and it was well overdue to rebound. The left and right shoulders are shaping up nicely in terms of their symmetry. I've drawn the triangle on each side to illustrate this occurrence. I'm anticipating higher volumes to come in as they started on Friday, and for the breakout to start in the $25.20 area. In November there was a third fan line break on increased volume to change the temporary direction from down to up. The customary throwback to the third fan line after breaking out ensues and the inevitable upward move will happen soon. |

|
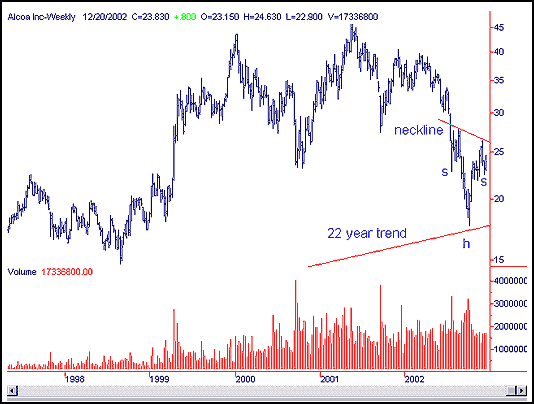
| Figure 2: Weekly chart of Alcoa, Inc. |
| Graphic provided by: SuperCharts. |
| |
| On the weekly chart there is huge volume at the base of the head and I must be cautious since it is still within the pattern. If the volume does not increase significantly then a breakout will not happen so a stop-loss must be used just under the $23.00 area. This is where the triangle and my second fan line intersect. My early warning will happen when the small triangle is broken in the $24.00 area prior to the breakout of the head and shoulders. |
 Figure 3: Monthly chart of Alcoa, Inc. The monthly chart shows the long-term trend that is intact and it will likely remain that way. |
Classic Dow Theorist who trades as a pure technician, using pattern recognition.
| Toronto, Canada |
Click here for more information about our publications!
Comments
Date: 12/30/02Rank: 4Comment:
Date: 12/31/02Rank: 4Comment:

|

Request Information From Our Sponsors
- VectorVest, Inc.
- Executive Premier Workshop
- One-Day Options Course
- OptionsPro
- Retirement Income Workshop
- Sure-Fire Trading Systems (VectorVest, Inc.)
- Trading as a Business Workshop
- VectorVest 7 EOD
- VectorVest 7 RealTime/IntraDay
- VectorVest AutoTester
- VectorVest Educational Services
- VectorVest OnLine
- VectorVest Options Analyzer
- VectorVest ProGraphics v6.0
- VectorVest ProTrader 7
- VectorVest RealTime Derby Tool
- VectorVest Simulator
- VectorVest Variator
- VectorVest Watchdog
- StockCharts.com, Inc.
- Candle Patterns
- Candlestick Charting Explained
- Intermarket Technical Analysis
- John Murphy on Chart Analysis
- John Murphy's Chart Pattern Recognition
- John Murphy's Market Message
- MurphyExplainsMarketAnalysis-Intermarket Analysis
- MurphyExplainsMarketAnalysis-Visual Analysis
- StockCharts.com
- Technical Analysis of the Financial Markets
- The Visual Investor
