HOT TOPICS LIST
- MACD
- Fibonacci
- RSI
- Gann
- ADXR
- Stochastics
- Volume
- Triangles
- Futures
- Cycles
- Volatility
- ZIGZAG
- MESA
- Retracement
- Aroon
INDICATORS LIST
LIST OF TOPICS
PRINT THIS ARTICLE
by Mark Rivest
Two stock indices to watch during the economic struggle.
Position: N/A
Mark Rivest
Independent investment advisor, trader and writer. He has written articles for Technical Analysis of Stocks & Commodities, Traders.com Advantage,Futuresmag.com and, Finance Magnates. Author of website Four Dimension Trading.
PRINT THIS ARTICLE
MOMENTUM
Trade War - USA Vs. China - Part Two
05/23/19 03:58:22 PMby Mark Rivest
Two stock indices to watch during the economic struggle.
Position: N/A
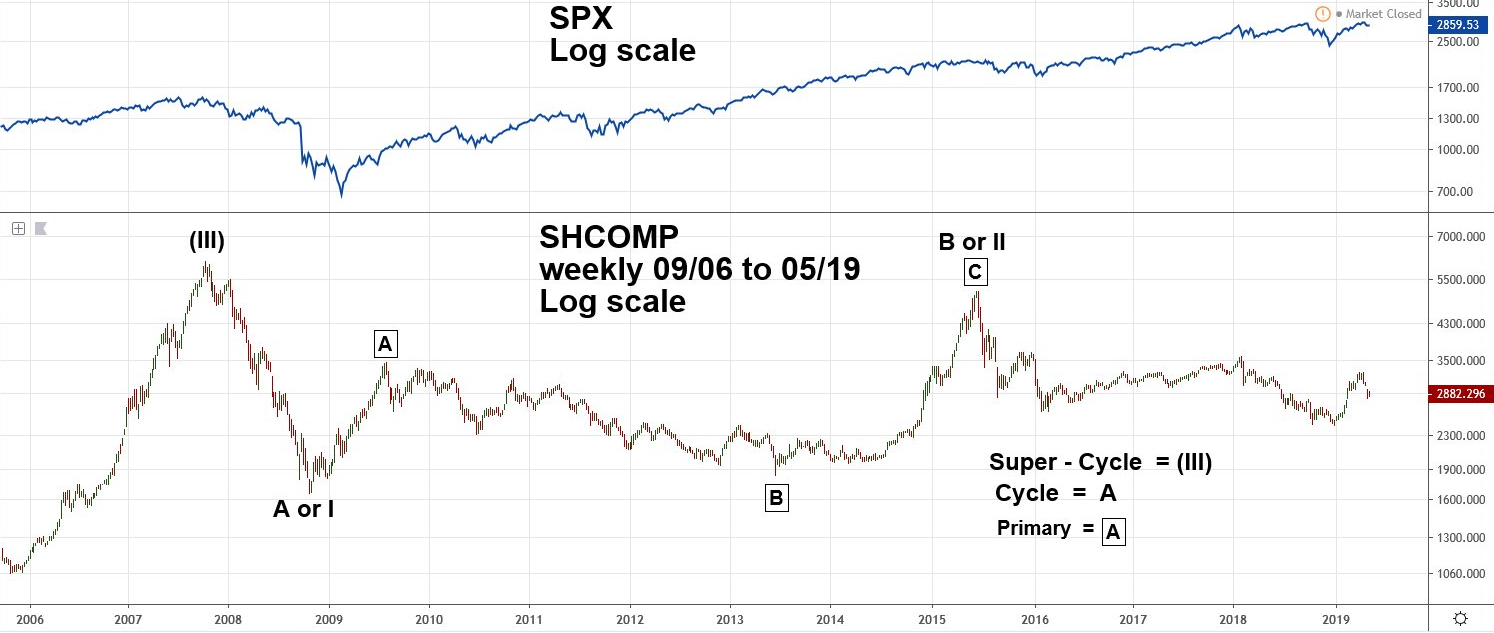
| Comprehensive study of any market requires review of all four dimensions: Price, Time, Sentiment, and Momentum. For stock markets, momentum can be measured by: Oscillation indicators such as Stochastics, advance/decline line, and inter-index relationships. Performance of one national stock index relative to another could yield valuable directional clues. Shanghai Composite - Weekly For approximately ten months the US and China have been involved in a trade war. Please see my July 12, 2018 article "Trade War - USA Vs. China", and note that both the Shanghai Composite (SHCOMP) and the S&P 500 (SPX) had lower prices than on May 17, 2019. During the interim there have been wide price swings, yet the net result has so far been higher prices. Does this mean rising tariffs won't severely affect the economy and stock prices. No, it just means tariffs have not gotten high enough to cause severe problems. Please see the weekly SHCOMP chart illustrated in Figure 1. Stock indices reflect the performance of a nation's economy. Since 2009 the US economy has been more robust than China's. This explains why US president Trump initiated the trade war, China has more to lose than the US. There's still risk of both economies/stock markets having deep declines. If emotions cloud thinking on both sides, nations can sometimes act against their best interest. The Elliott wave count from 2007 to 2008 is a very clear impulse wave. The move up from the 2008 bottom to the high made in 2015 is a clean Single Zigzag, while the pattern that follows this peak is ambiguous. SHCOMP could be in the process of moving down to major support at 2000, or a rally to significant resistance at 5000, there's currently no high probable wave count. We need to examine near term support/resistance for primary trend clues. |

|
| Figure 1. The Elliott wave count from 2007 to 2008 is a very clear impulse wave. |
| Graphic provided by: tradingview.com. |
| |
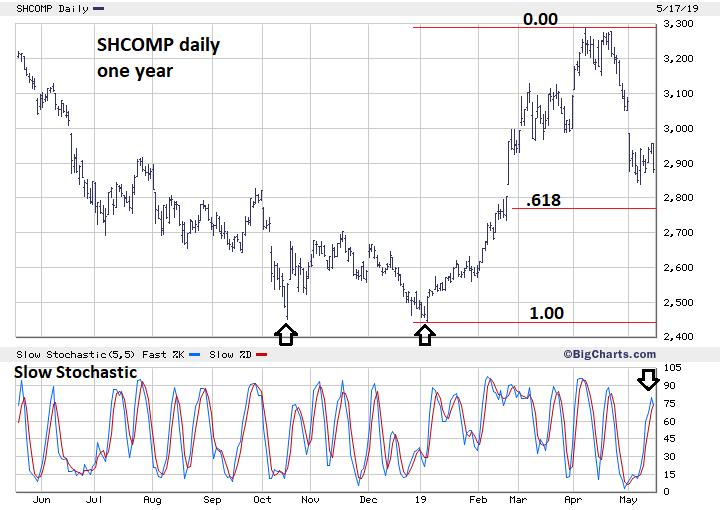
| Shanghai Composite - Daily Please see the daily SHCOMP chart illustrated in Figure 2. From January to April 2019 SHCOMP, SPX and other national stock indices have had robust rallies. SHCOMP continues to underperform the SPX as its decline from April to the most recent bottom on May 10 was 13%. The SPX May 1 to May 13 drop was only 5%. An SHCOMP move above its April 8 high could be a very bullish signal for the global stock market. The more likely near-term path for SHCOMP is down, note the daily Slow Stochastic has reached the overbought zone with a bearish crossover. There's a very good chance the .618 support area at 2760 could be reached. If this level is broken, the double bottom at 2440 and 2449 could be formidable support. If SHCOMP breaks below that barrier it opens the door for a move down to 2000 and possibly signal a global bear market. |

|
| Figure 2. The double bottom at 2440 and 2449 could be formidable support. |
| Graphic provided by: BigCharts.com. |
| |
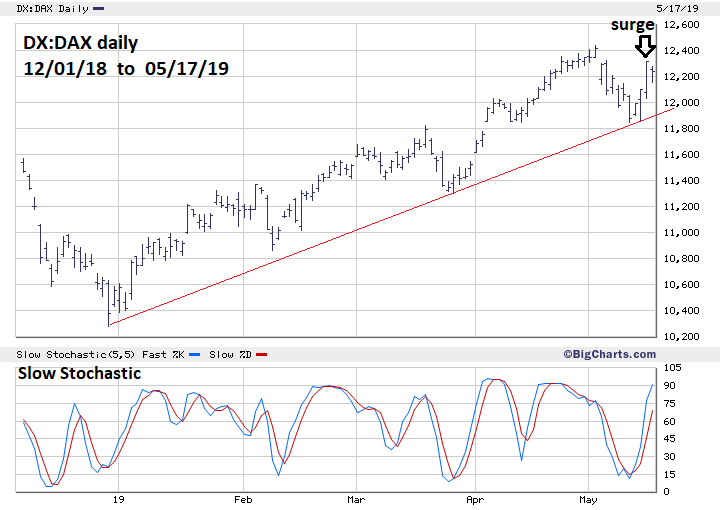
| German DAX - Daily Germany and the rest of the world economy will also be affected by what happens with the USA and China trade war. Please see the daily German DAX (DX:DAX) chart illustrated in Figure 3. Since late December 2018 DX:DAX has moved up with the SPX. However, longer term the SPX made a new all-time high, while DX:DAX is well below its all-time high made in January 2018. In the short-term DX:DAX is outperforming the SPX. On May 16 DX:DAX had a surge that moved it to about an 80% retracement of the recent decline. The corresponding SPX retracement was only about 60%. If near-term the DX:DAX can exceed its May 3 high or decline less, relative to the SPX, it could be a bullish signal for the global bull market. |

|
| Figure 3. On May 16 DX:DAX had a surge that moved it to about an 80% retracement of the recent decline. |
| Graphic provided by: BigCharts.com. |
| |
| Conclusion In the next few weeks the two most important markets to watch are SHCOMP and DX:DAX. Either one, or both, could be giving signals affecting the global stock market for several months. Some traders think that if they only trade in one national stock market there's no need to know what's happening in other nations' stock markets. This could be a big mistake, leading to missed trading opportunities and losses. Look at the big picture and use a comprehensive approach to market analysis. It's not just one price pattern or indicator that could lead you to success, it's the weight of evidence from many indicators, and some of these indicators could be thousands of miles from where you live. Further Reading: Frost A.J and Robert Prechter (1985) "Elliott Wave Principle", New Classics Library. |
Independent investment advisor, trader and writer. He has written articles for Technical Analysis of Stocks & Commodities, Traders.com Advantage,Futuresmag.com and, Finance Magnates. Author of website Four Dimension Trading.
| Website: | www.fourdimensiontrading.com |
| E-mail address: | markrivest@gmail.com |
Click here for more information about our publications!
PRINT THIS ARTICLE

Request Information From Our Sponsors
- VectorVest, Inc.
- Executive Premier Workshop
- One-Day Options Course
- OptionsPro
- Retirement Income Workshop
- Sure-Fire Trading Systems (VectorVest, Inc.)
- Trading as a Business Workshop
- VectorVest 7 EOD
- VectorVest 7 RealTime/IntraDay
- VectorVest AutoTester
- VectorVest Educational Services
- VectorVest OnLine
- VectorVest Options Analyzer
- VectorVest ProGraphics v6.0
- VectorVest ProTrader 7
- VectorVest RealTime Derby Tool
- VectorVest Simulator
- VectorVest Variator
- VectorVest Watchdog
- StockCharts.com, Inc.
- Candle Patterns
- Candlestick Charting Explained
- Intermarket Technical Analysis
- John Murphy on Chart Analysis
- John Murphy's Chart Pattern Recognition
- John Murphy's Market Message
- MurphyExplainsMarketAnalysis-Intermarket Analysis
- MurphyExplainsMarketAnalysis-Visual Analysis
- StockCharts.com
- Technical Analysis of the Financial Markets
- The Visual Investor
