HOT TOPICS LIST
- MACD
- Fibonacci
- RSI
- Gann
- ADXR
- Stochastics
- Volume
- Triangles
- Futures
- Cycles
- Volatility
- ZIGZAG
- MESA
- Retracement
- Aroon
INDICATORS LIST
LIST OF TOPICS
PRINT THIS ARTICLE
by Andrew Hetherington
This one almost seems too easy. Naturally, this will be cursed since I said this. Nonetheless, this industry behemoth is ready to spring higher.
Position: N/A
Andrew Hetherington
Classic Dow Theorist who trades as a pure technician, using pattern recognition.
PRINT THIS ARTICLE
CHART ANALYSIS
Exxon Mobil is Forging Ahead
12/19/02 01:24:25 PMby Andrew Hetherington
This one almost seems too easy. Naturally, this will be cursed since I said this. Nonetheless, this industry behemoth is ready to spring higher.
Position: N/A
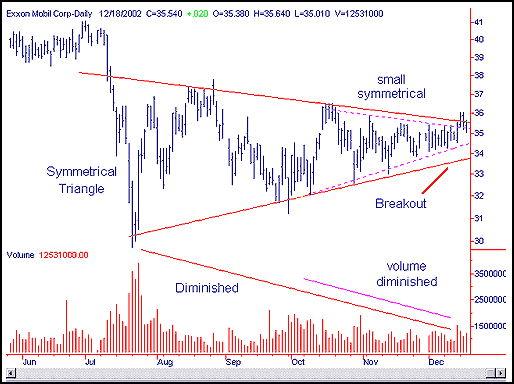
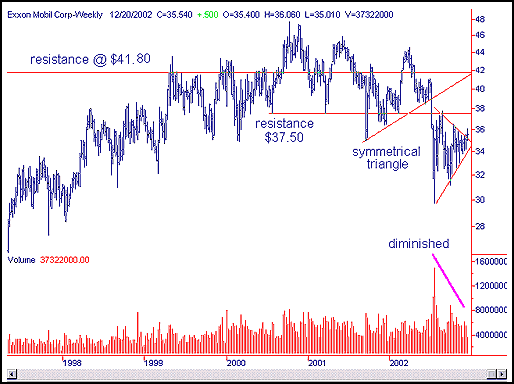
 Figure 1: Daily chart of Exxon Mobil (XOM). On the daily chart we have a small 2-month symmetrical triangle. You can see the coil effect clearly on this chart. The slowly diminished volume defines the pattern. This spring-like effect of a triangle is from the struggle between supply and demand until one force overcomes the other and it springs out of the pattern with a flurry of activity. In addition, there is a larger 5-6 month symmetrical triangle. The volume on this pattern is also slowly diminished and can be seen more easily on the weekly chart in Figure 2. |

|
| Figure 2: Weekly chart of Exxon Mobil. |
| Graphic provided by: SuperCharts. |
| |
| There has been an early warning of upcoming events with a slight increase in volume the past four days. This represents the breakout from the smaller triangle. This early warning I so often discuss helps determine when the breakouts may occur as well as which direction. This is most useful when trading options since the direction and the timing are critical. |
| The breakout that I'm anticipating from the larger triangle should carry this equity to the first resistance area of $37.50. After this breakout it should eventually reach the next resistance level of $41.80. This may not seem like a big move but this can be very profitable if traded correctly. In the event of a misread I suggest a stop-loss in the $33.75 area to protect against the downside risk. |
Classic Dow Theorist who trades as a pure technician, using pattern recognition.
| Toronto, Canada |
Click here for more information about our publications!
Comments
Date: 12/20/02Rank: 4Comment:
Date: 12/28/02Rank: 5Comment:
Date: 12/31/02Rank: 5Comment:

Request Information From Our Sponsors
- StockCharts.com, Inc.
- Candle Patterns
- Candlestick Charting Explained
- Intermarket Technical Analysis
- John Murphy on Chart Analysis
- John Murphy's Chart Pattern Recognition
- John Murphy's Market Message
- MurphyExplainsMarketAnalysis-Intermarket Analysis
- MurphyExplainsMarketAnalysis-Visual Analysis
- StockCharts.com
- Technical Analysis of the Financial Markets
- The Visual Investor
- VectorVest, Inc.
- Executive Premier Workshop
- One-Day Options Course
- OptionsPro
- Retirement Income Workshop
- Sure-Fire Trading Systems (VectorVest, Inc.)
- Trading as a Business Workshop
- VectorVest 7 EOD
- VectorVest 7 RealTime/IntraDay
- VectorVest AutoTester
- VectorVest Educational Services
- VectorVest OnLine
- VectorVest Options Analyzer
- VectorVest ProGraphics v6.0
- VectorVest ProTrader 7
- VectorVest RealTime Derby Tool
- VectorVest Simulator
- VectorVest Variator
- VectorVest Watchdog
