

HOT TOPICS LIST
- MACD
- Fibonacci
- RSI
- Gann
- ADXR
- Stochastics
- Volume
- Triangles
- Futures
- Cycles
- Volatility
- ZIGZAG
- MESA
- Retracement
- Aroon
INDICATORS LIST
LIST OF TOPICS
PRINT THIS ARTICLE
by Mark Rivest
Recent surge of its stock could be the final piece of a nineteen-year pattern.
Position: N/A
Mark Rivest
Independent investment advisor, trader and writer. He has written articles for Technical Analysis of Stocks & Commodities, Traders.com Advantage,Futuresmag.com and, Finance Magnates. Author of website Four Dimension Trading.
PRINT THIS ARTICLE
ELLIOTT WAVE
The Amazing Price Moves Of Qualcomm
05/02/19 04:24:50 PMby Mark Rivest
Recent surge of its stock could be the final piece of a nineteen-year pattern.
Position: N/A
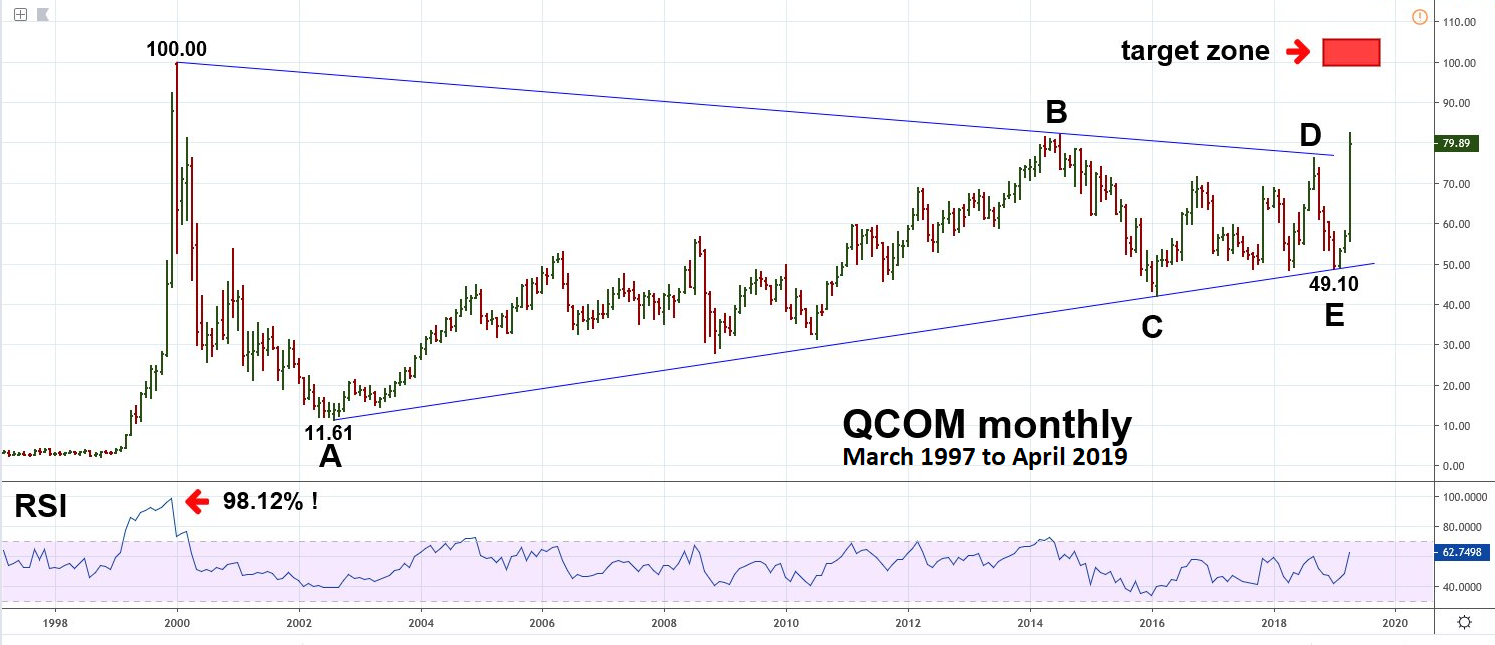
| Qualcomm, Inc. (QCOM) designs, develops, manufactures, and markets digital communication products worldwide. On April 16, Apple, Inc. (AAPL) and QCOM agreed to dismissal of litigation worldwide in a settlement that involves AAPL paying QCOM. The news triggered a two-day 44% rally for QCOM, an incredible feat for a large cap stock. QCOM had a similar move back in 1999; the 2019 buying panic could meet the same fate as its predecessor. Qualcomm 1999-2019 Please see the monthly QCOM illustrated in Figure 1. From 1998 to early 2000 technology stocks were at the center of a stock buying mania which resulted in a blow off top like what occasionally happens in the Commodities markets. QCOM was one of the mania leaders, going from 5.00 to 100.00 in less than a year, recording a monthly RSI of 98% — extremely rare. What happened next is equally amazing; in the span of just two and a half years QCOM declined 89%! Another incredible aspect of QCOM's journey from the all-time high of 100.00 is that it may have formed a colossal nineteen-year Elliott wave Horizontal Triangle. This is a corrective pattern composed of five overlapping waves with each of the five waves subdividing into structures of three waves or a combination of three waves. In most triangles the termination points of waves (A, C, E) and (B, D) are connected by trendlines. The supposed QCOM triangle is nearly perfect. Typically, there are Fibonacci relationships between the sub waves of the triangle — the pattern from 2000 to 2019 has three relationships. The lengths of each wave are: A = 88.39, B = 70.36, C= 39.73, D = 34.26, E = 27.40. D 34.26/ A 88.39 = .387, close to .382 E 27.40/ B 70.36 = .389 D 34.26/ B 70.36 = .489, close to .50 After a Horizontal Triangle terminates there's usually a thrust in the direction of the primary trend. This is exactly what happened after the supposed wave "E" bottom at 49.10. |
|
| Figure 1. Another incredible aspect of QCOM�s journey from the all-time high of 100.00 is that it may have formed a colossal nineteen-year Elliott wave Horizontal Triangle. |
| Graphic provided by: tradingview.com. |
| |
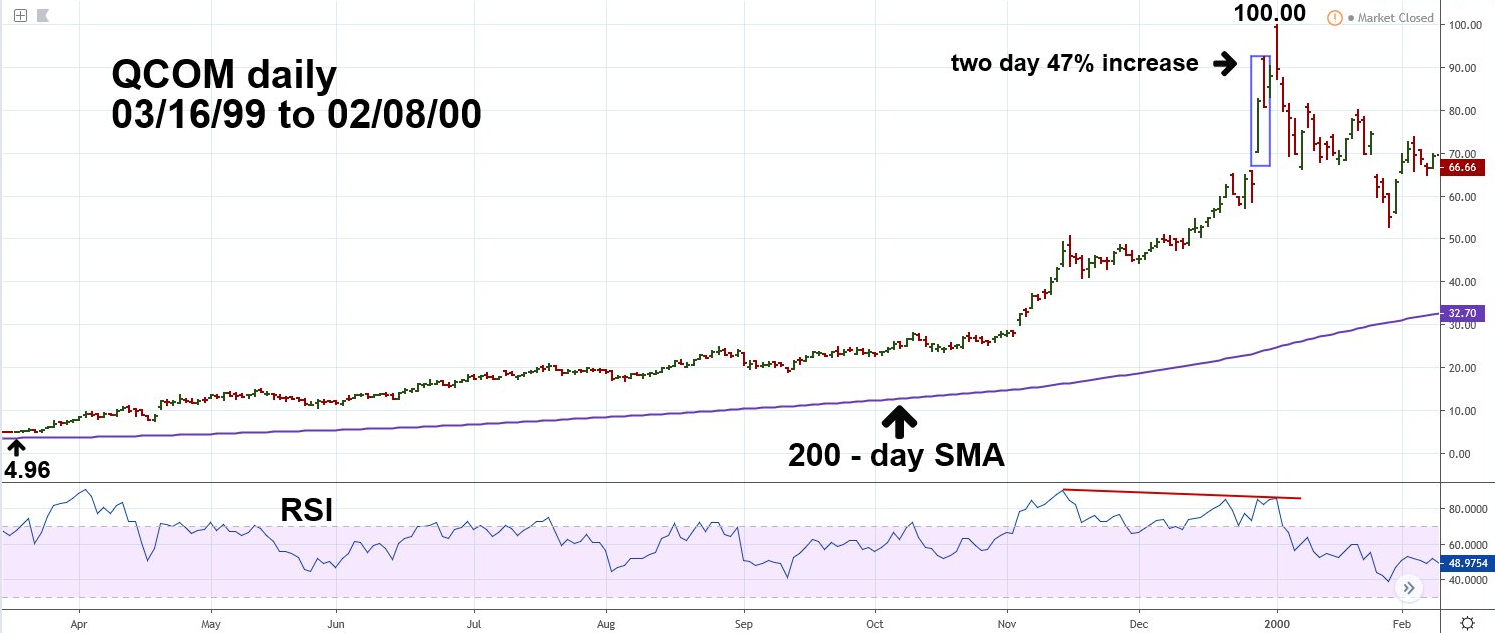
| Qualcomm 1999-2000 Using the 200-day Simple Moving Average (SMA) is another way to understand how extraordinary QCOM's 1999 rally was. Please see the daily QCOM chart 1999 to 2000 illustrated in Figure 2. Typically stocks with large rallies will, at their peaks, be about 150% above the 200-day SMA. QCOM at its high of 100.00 on January 3, 2000 was 310% above its SMA. Just before the final peak QCOM had a two-day surge of 47%, then a one day pause, followed by the last rally day into the all-time high of 100.00. Daily RSI was at 85% diverging off the high recorded on November 12, 1999. This, combined with the 98% monthly RSI, and potential round number price resistance gave clues that QCOM was due for at least a correction. |
|
| Figure 2. Just before the final peak, QCOM had a two-day surge of 47%. |
| Graphic provided by: tradingview.com. |
| |
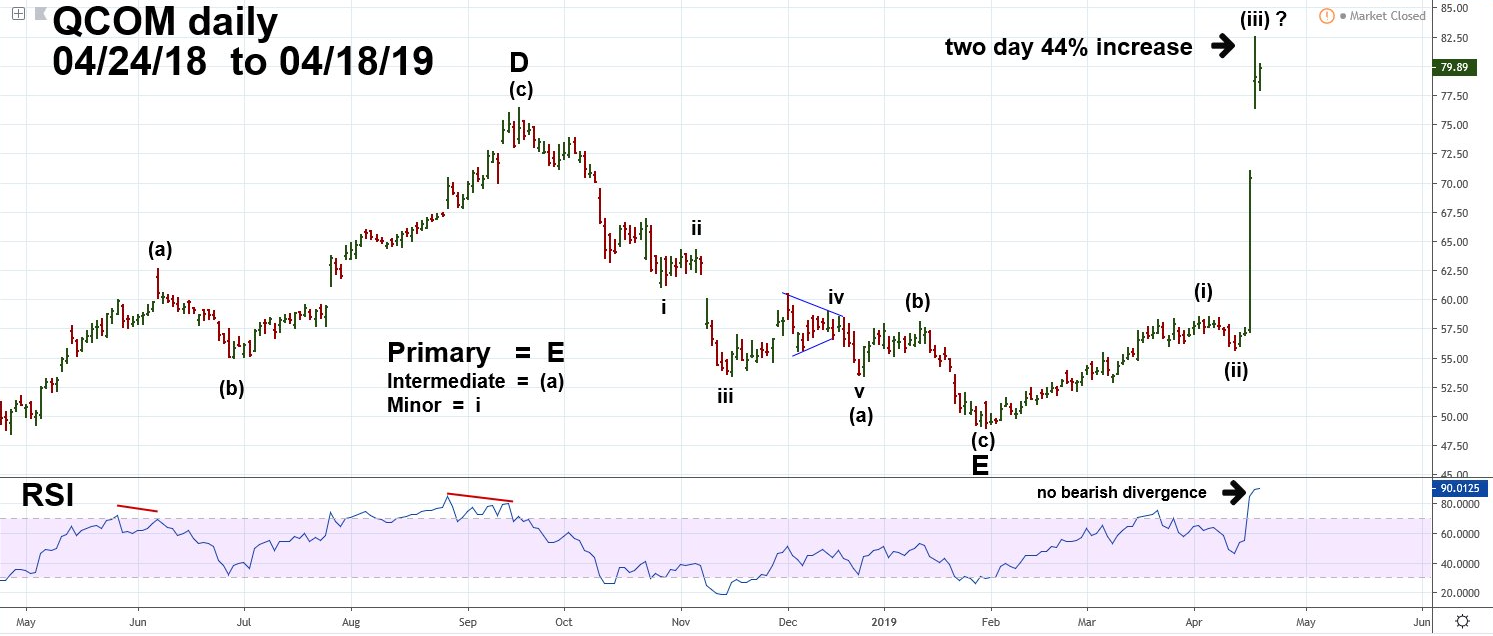
| Qualcomm 2018-2019 The daily QCOM chart in Figure 3 illustrates the Elliott wave subdivisions of the latter part of the supposed Horizontal Triangle and post triangle thrust. Each sub wave of a triangle should divide into a three-wave structure or a combination of three wave patterns. The QCOM decline from September 2018 to January 2019 is a clear Single Zigzag pattern (a), (b), (c). Also note that Minor wave "iv" of Intermediate wave (a) is a one-month Horizontal Triangle; this is a miniaturized version of the probable nineteen-year Horizontal Triangle. Only the last part of Primary wave "D" is illustrated. The supposed wave "D" which began in February 2016 appears to be a Double Zigzag, the second Zigzag is shown on the chart. A Double Zigzag wave "D" followed by a Single Zigzag wave "E" is an example of the Elliott wave guideline for alternation and is additional evidence that the QCOM structure from 2000 to February 2019 is most likely a Horizontal Triangle. The move up from the February bottom of 49.10 appears to be forming an Elliott five wave impulse with the third wave possibly complete on April 17. Evidence that this could be the correct count comes from the daily RSI which is confirming price. If Intermediate wave (iv) has started it may last only a few days followed by a fifth wave up exceeding the recent high at 82.52. Post Horizontal Triangle thrusts are usually measured by the widest point of the triangle, which in this case is 88.39 points added to the triangle's termination point of 49.10 targets 137.49 as a possible top. There's a secondary Fibonacci coordinate at 100.00. This is equality — a complete retracement of QCOM initial decline to 11.61. Multiplying 88.39 by the Fibonacci Golden ratio of .618 equals 54.62 added to 49.10 targets 103.72. Being close to 100.00 makes this the more likely target zone for what could be a significant peak. QCOM's two-day surge in April 2019 was 44% while the two-day surge in 1999 was 47%. |
|
| Figure 3. QCOM�s two-day surge in April 2019 was 44% while the two-day surge in 1999 was 47%. |
| Graphic provided by: tradingview.com. |
| |
| Conclusion On January 3, 2000, QCOM just after a two-day surge of 47% made a very important top. On January 14, 2000, the Dow Jones Industrial Average reached the high point of a ten-year bull market. In March of 2000 the Nasdaq Composite and SPX completed their ten-year bull markets. Besides the 1999 and 2019 two-day surges there was another in July 2008. Following this surge QCOM had a marginal move up which terminated on August 15, 2008. In the subsequent decline which ended in November 2008, QCOM lost 50% of its value. This QCOM decline corresponded with the worst part of the SPX 2007 to 2009 bear market. The prior QCOM two-day surges appear to be the kiss of death for both QCOM and the broader stock market rallies. Another bearish factor is that on December 31, 1999, just before the all-time high, QCOM had a four for one stock split. The greater a stock's supply, called its float, the harder it is to push a stock up. In 2019 with a much larger float, QCOM may not even reach 100.00. US stocks are seasonally bullish into early May. On April 17 the SPX hit a rally high of 2918. My February 1, 2018 article "How High is Up?" noted major SPX Fibonacci resistance is at 3047. If in early May 2019 the SPX is trading near 3047 and QCOM is near, or has already reached somewhere near 100.00, it could be another kiss of death for the US stock market. Further Reading: Frost A.J and Robert Prechter (1985) "Elliott Wave Principle", New Classics Library. |
Independent investment advisor, trader and writer. He has written articles for Technical Analysis of Stocks & Commodities, Traders.com Advantage,Futuresmag.com and, Finance Magnates. Author of website Four Dimension Trading.
| Website: | www.fourdimensiontrading.com |
| E-mail address: | markrivest@gmail.com |
Click here for more information about our publications!
PRINT THIS ARTICLE

Request Information From Our Sponsors
- StockCharts.com, Inc.
- Candle Patterns
- Candlestick Charting Explained
- Intermarket Technical Analysis
- John Murphy on Chart Analysis
- John Murphy's Chart Pattern Recognition
- John Murphy's Market Message
- MurphyExplainsMarketAnalysis-Intermarket Analysis
- MurphyExplainsMarketAnalysis-Visual Analysis
- StockCharts.com
- Technical Analysis of the Financial Markets
- The Visual Investor
- VectorVest, Inc.
- Executive Premier Workshop
- One-Day Options Course
- OptionsPro
- Retirement Income Workshop
- Sure-Fire Trading Systems (VectorVest, Inc.)
- Trading as a Business Workshop
- VectorVest 7 EOD
- VectorVest 7 RealTime/IntraDay
- VectorVest AutoTester
- VectorVest Educational Services
- VectorVest OnLine
- VectorVest Options Analyzer
- VectorVest ProGraphics v6.0
- VectorVest ProTrader 7
- VectorVest RealTime Derby Tool
- VectorVest Simulator
- VectorVest Variator
- VectorVest Watchdog