HOT TOPICS LIST
- MACD
- Fibonacci
- RSI
- Gann
- ADXR
- Stochastics
- Volume
- Triangles
- Futures
- Cycles
- Volatility
- ZIGZAG
- MESA
- Retracement
- Aroon
INDICATORS LIST
LIST OF TOPICS
PRINT THIS ARTICLE
by Mark Rivest
See how time could be used to find market turns. RN Elliott not only discovered the wave principle but also discovered that market movements can be measured using the Fibonacci sequence. Utilizing the time dimension in conjunction with price can improve your chances of finding market turns. Using data from the last two decades indicates the US stock market could have a significant peak sometime in 2019.
Position: N/A
Mark Rivest
Independent investment advisor, trader and writer. He has written articles for Technical Analysis of Stocks & Commodities, Traders.com Advantage,Futuresmag.com and, Finance Magnates. Author of website Four Dimension Trading.
PRINT THIS ARTICLE
FIBONACCI
Fibonacci Time Sequences
03/14/19 04:01:24 PMby Mark Rivest
See how time could be used to find market turns. RN Elliott not only discovered the wave principle but also discovered that market movements can be measured using the Fibonacci sequence. Utilizing the time dimension in conjunction with price can improve your chances of finding market turns. Using data from the last two decades indicates the US stock market could have a significant peak sometime in 2019.
Position: N/A
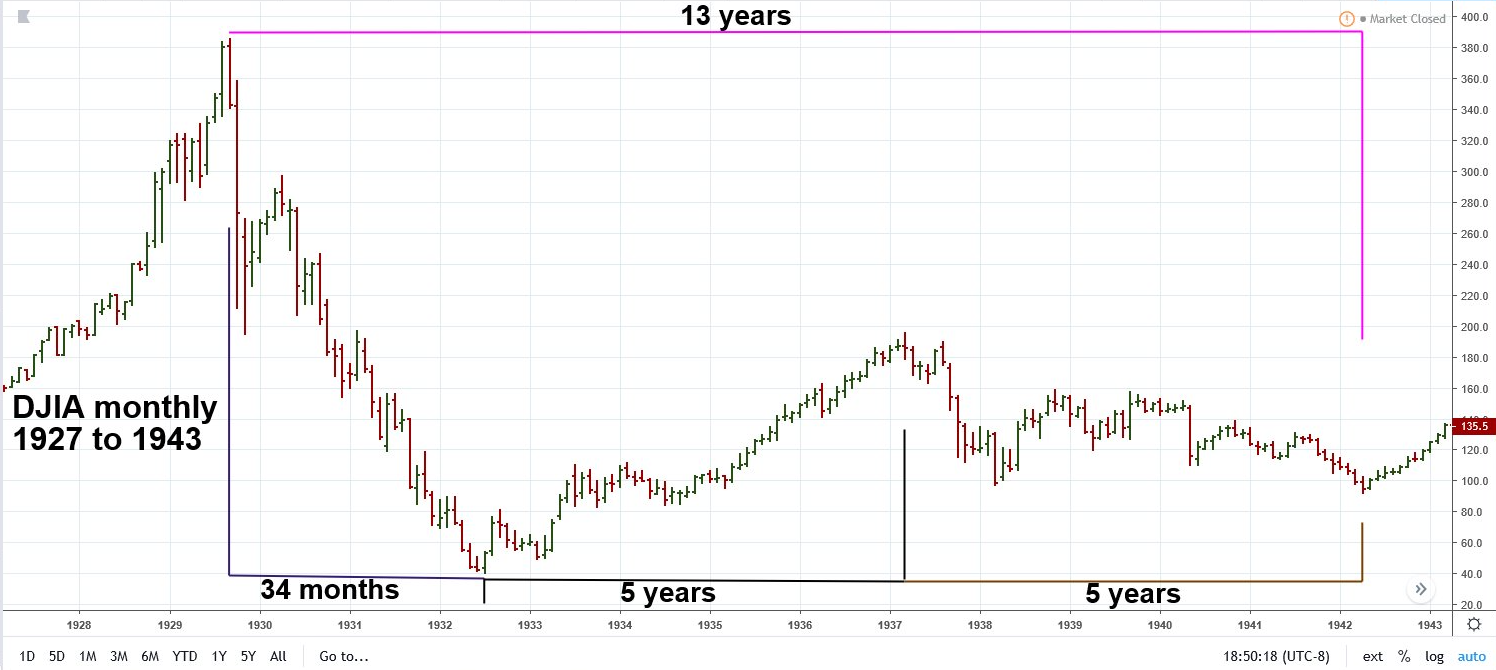
| Dow Jones Industrial Average 1927 to 1943 The Fibonacci sequence is: 1, 1, 2, 3 ,5, 8, 13, 21, 34, 55, 89, 144, 233, to infinity. Each Fibonacci number, when added to the prior number in the sequence, yields the next number of the sequence. Soon after he discovered the wave principle — now called the "Elliott Wave Theory", RN Elliott was introduced to the concept of Fibonacci ratios and sequence which tied in with his wave theory. Waves progress in five waves and retrace in three waves, 3 and 5 are part of the Fibonacci sequence. He then learned that Fibonacci sequence applied not just to price, but also to time. Please see the Dow Jones Industrial Average (DJIA) 1927 to 1943 monthly chart illustrated in Figure 1. These are some of the time relationships Elliott discovered within the DJIA from 1929 to 1942. The time sequence can occur on yearly, monthly, weekly and daily time scales. For intraday traders, the time sequence can be found on hourly charts and even down to minutes. Decades later, Robert Prechter discovered that market movements can also be measured in multiples of the Fibonacci sequence. In his 2003 book, "Beautiful Pictures", Prechter noted that the secular bull market that began in 1932 and terminated in the year 2000 was 68 years — not a Fibonacci number. However, it is a multiple of the Fibonacci number 34 x 2 = 68. Prechter also discovered many other Fibonacci time relationships within the wave structure from 1932 to 2000. Proving that the concept of an expanding wave structure can extend several decades. |

|
| Figure 1. These are some of the time relationships Elliott discovered within the DJIA from 1929 to 1942. |
| Graphic provided by: tradingview.com. |
| |
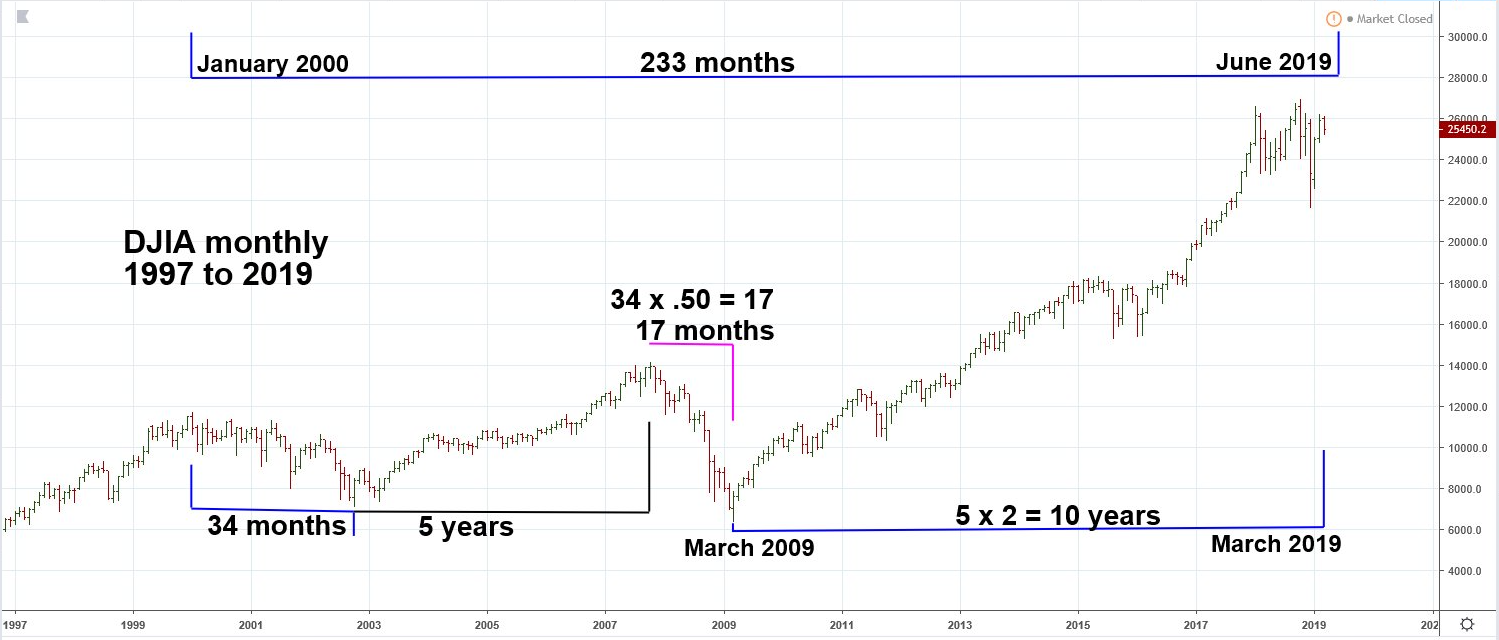
| Dow Jones Industrial Average 1997 to 2019 The first three major DJIA moves since the dawn of the twenty-first century can be measured by the Fibonacci sequence. Please see the DJIA monthly chart 1997 to 2019 illustrated in Figure 2. January 2000 to October 2002 was thirty-four months. The subsequent bull market was exactly five years. The decline from 2007 looked like it was pushing for a twenty-one month decline, but terminated after only seventeen months. Not a Fibonacci number, however it was half of thirty-four. The 2007 to 2009 bear market was truly vicious, declining 54% in half the time of the 2000 to 2002 38% drop. The bull market that began in 2009 made its so far high point in 2018 — nine years. This is not a Fibonacci number, nor is it two times or half of a Fibonacci number. October 2018 could have been the end of the secular bull market, but with nearly one hundred years of significant stock market moves measured by using the Fibonacci sequence there's reason to be suspicious. The DJIA could be headed to a major top in 2022, thirteen years after the 2009 bottom, however there could be another cycle underway. The second bear market of the twenty-first century was half the length as the first bear market, perhaps the second bull market since the year 2000 will be twice the length of the 2002 to 2007 bull move? March 2019 is exactly ten years from the March 2009 bottom, this type of precision is rare and when using Fibonacci years, the turn could come anywhere within the target year of 2019. Perhaps June 2019 could be the target month for the bull market top, as it's a Fibonacci 233 months from the January 2000 peak. |

|
| Figure 2. The 2007 to 2009 bear market was truly vicious, declining 54% in half the time of the 2000 to 2002 38% drop. |
| Graphic provided by: tradingview.com. |
| |
| The Nature of Stock Market Tops The DJIA major top in 1929 came after an eight-year bull market. The 1937 top after a five-year bull. When the DJIA peaked at 1000 in 1966 it culminated a thirty-four year secular bull market. These are just a few of the significant peaks that came on a Fibonacci sequence number. The so far all-time highs for all three main US stock indices came in 2018 — not at a Fibonacci sequence number. While this could be a major top it is a low probability. Probabilities favor a major top being made in 2019 at two times five years, or in 2022. US stocks are seasonally bullish into early May. Most major tops among the three main US stock indices come at different times. Currently, the DJIA is the strongest index, if a major top is made in the next few months the DJIA will likely top last. The broad time zone for a possible major US stock market peak is from March to June 2019. My March 1 article, "Discovering Market Tops with Fibonacci Extensions", noted the S&P 500 has potentially major Fibonacci resistance at 3047. If between March and June the S&P 500 reaches 3047 along with the DJIA and Nasdaq Composite making all-time highs, the final pieces of a ten-year bull market could be in place. Further Reading: Prechter Robert (2003) "Beautiful Pictures", New Classics Library. Frost A.J and Robert Prechter (1985) "Elliott Wave Principle", New Classics Library. |
Independent investment advisor, trader and writer. He has written articles for Technical Analysis of Stocks & Commodities, Traders.com Advantage,Futuresmag.com and, Finance Magnates. Author of website Four Dimension Trading.
| Website: | www.fourdimensiontrading.com |
| E-mail address: | markrivest@gmail.com |
Click here for more information about our publications!
Comments
Date: 03/16/19Rank: 1Comment:

|

Request Information From Our Sponsors
- StockCharts.com, Inc.
- Candle Patterns
- Candlestick Charting Explained
- Intermarket Technical Analysis
- John Murphy on Chart Analysis
- John Murphy's Chart Pattern Recognition
- John Murphy's Market Message
- MurphyExplainsMarketAnalysis-Intermarket Analysis
- MurphyExplainsMarketAnalysis-Visual Analysis
- StockCharts.com
- Technical Analysis of the Financial Markets
- The Visual Investor
- VectorVest, Inc.
- Executive Premier Workshop
- One-Day Options Course
- OptionsPro
- Retirement Income Workshop
- Sure-Fire Trading Systems (VectorVest, Inc.)
- Trading as a Business Workshop
- VectorVest 7 EOD
- VectorVest 7 RealTime/IntraDay
- VectorVest AutoTester
- VectorVest Educational Services
- VectorVest OnLine
- VectorVest Options Analyzer
- VectorVest ProGraphics v6.0
- VectorVest ProTrader 7
- VectorVest RealTime Derby Tool
- VectorVest Simulator
- VectorVest Variator
- VectorVest Watchdog
