

HOT TOPICS LIST
- MACD
- Fibonacci
- RSI
- Gann
- ADXR
- Stochastics
- Volume
- Triangles
- Futures
- Cycles
- Volatility
- ZIGZAG
- MESA
- Retracement
- Aroon
INDICATORS LIST
LIST OF TOPICS
PRINT THIS ARTICLE
by Mark Rivest
See how major peaks could be found months, or years, in advance.
Position: N/A
Mark Rivest
Independent investment advisor, trader and writer. He has written articles for Technical Analysis of Stocks & Commodities, Traders.com Advantage,Futuresmag.com and, Finance Magnates. Author of website Four Dimension Trading.
PRINT THIS ARTICLE
FIBONACCI
Discovering Market Tops With Fibonacci Extensions
03/01/19 12:51:34 PMby Mark Rivest
See how major peaks could be found months, or years, in advance.
Position: N/A
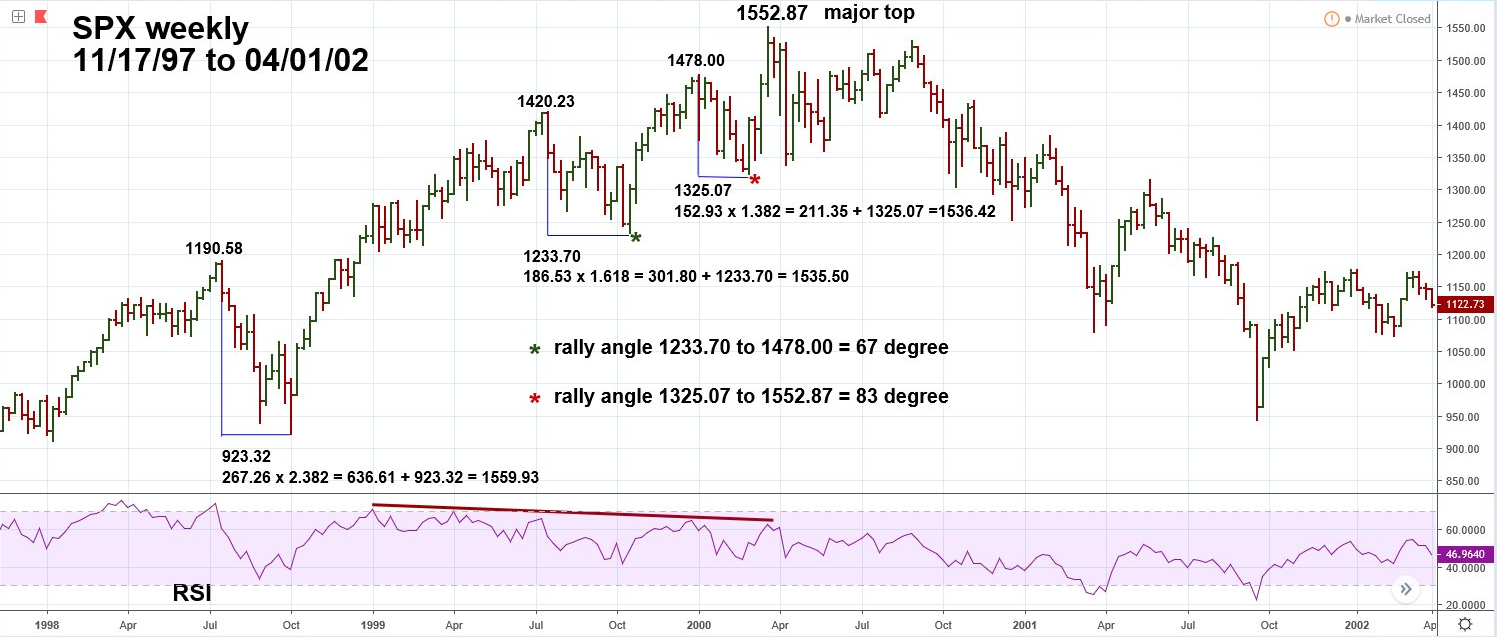
| Occasionally a market top can be calculated by using Fibonacci extensions. This method measures the length of a bear market, or downside correction. The length is then multiplied by a Fibonacci extension ratio yielding an amount which when added to the bear market/correction bottom, targets a potential market peak. The technique could provide an important clue to a significant US stock market top in 2019. S&P 500 - 1997 to 2002 Two types of Fibonacci ratios are used for market analysis. Retrace ratios such as .382, .50, and .618 measure market retracements of upward on downward progress. Extension ratios of 1.382, 1.50, 1.618, 2.00, 2.382, 2.618 to infinity project possible upside or downside targets. Please see the weekly S&P 500 (SPX) chart illustrated in Figure 1. The SPX 1998 large correction was noted in my February 7 article "Using History to Forecast the Future". The SPX July to October 1998 decline was 267.26 points multiplied by the Fibonacci extension ratio of 2.382 = 636.61 SPX points added to the October 1998 bottom of 923.32 targets SPX 1559.93. The actual top of the SPX secular bull market in March of 2000 was 1552.87 — a near bulls-eye hit! Sometimes secondary Fibonacci extension coordinates can be found by examining small corrections of the primary movement. The July to October 1999 decline yielded a target of 1535.50 and the January to February 2000 decline projected 1536.11. Both coordinates are only 1% below the ultimate top. If you can find two or more projection coordinates close together it increases the probabilities of a market peak. Another phenomenon of markets rallying into Fibonacci extension points is that speed increases on the last leg of the primary movement. Note that the final rally February to March 2000 had a rally angle of 83 degrees vs. an angle of 67 degrees of the prior October 1999 to January 2000 rally. It's as if the Fibonacci point is a magnet drawing the market up. Also note the significant weekly RSI bearish divergence indicating waning upside momentum despite a short term burst of speed. |
|
| Figure 1. Sometimes secondary Fibonacci extension coordinates can be found by examining small corrections of the primary movement. |
| Graphic provided by: tradingview.com. |
| |
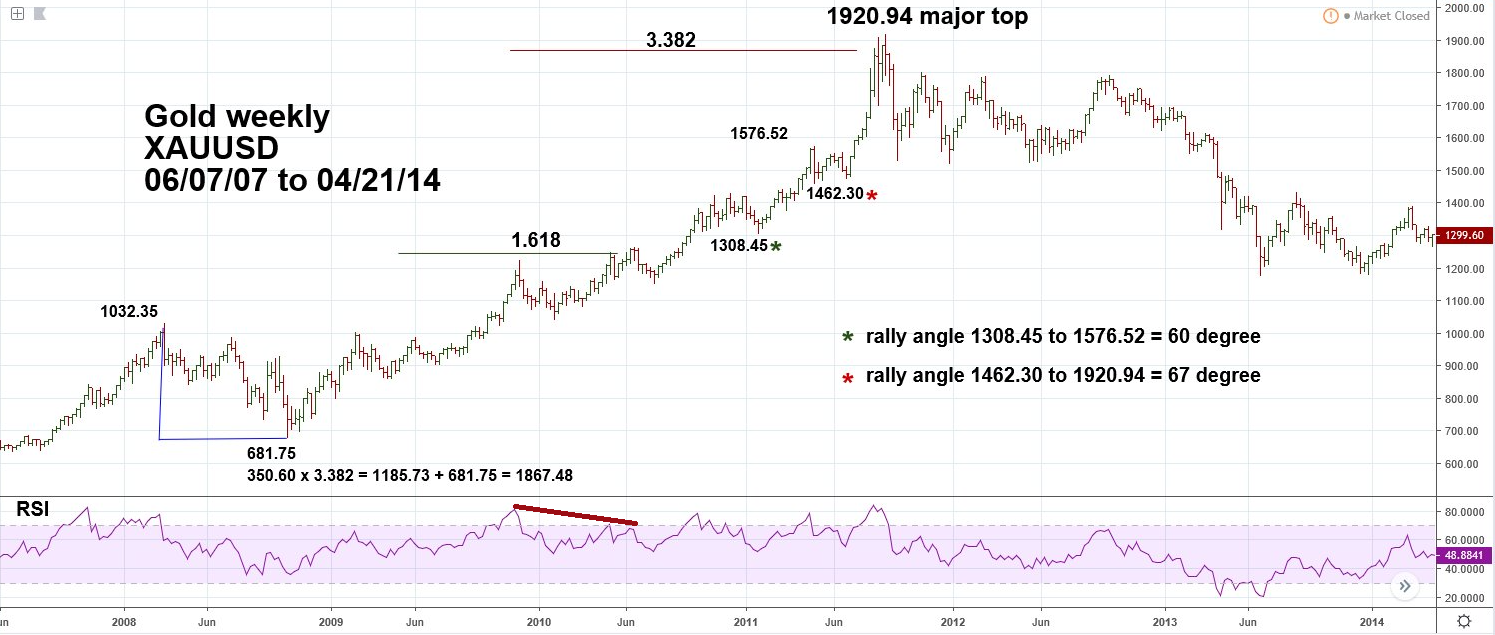
| Gold - 2007 to 2014 Weekly Gold/US dollars (XAUUSD) chart illustrated in Figure 2 shows how the March to October 2008 correction forecast the major top made in September of 2011. In this situation the target price of 1867.48 was 2.8% below the actual target. Bulls-eye hits are the exception, as a rule allow leeway around a Fibonacci coordinate. There's no fixed percentage for how much leeway to use and it can vary depending how much time separates the target from the forecasts point of origin and other technical factors. Note again the final thrust up was a 67-degree angle vs. a 60-degree angle for the penultimate rally. Occasionally a market will reach a Fibonacci projection, decline then rally above the targeted top. This is what happened in May 2010 when gold reached 1249.40. The 1.618 Fibonacci coordinate was 1249.02 with a significant weekly bearish divergence, strong evidence to go short Gold. For this example, let's assume you're trading a one for one Gold ETF -- risk parameters would be tighter for leveraged instruments. You short at 1248.70 using a 3% stop loss. After entry Gold drops to 1166.50 then begins a new rally to 1265.05, no problem this is only 1.3% above entry and within the leeway zone. Then another decline to 1157.05, again the bears fail as a new rally rises beyond the last top at 1265.05. The move above both the Fibonacci resistance at 1249.40 and chart support at 1265.05 is a very bullish signal. Breaks above Fibonacci and chart resistance open the door for a move to the next Fibonacci extension point which in this case is 2.00, or Gold 1382.95. Trading strategy would be to exit the short just above 1265.05 and enter a long position. |
|
| Figure 2. Occasionally a market will reach a Fibonacci projection, decline, then rally above the targeted top. |
| Graphic provided by: tradingview.com. |
| |
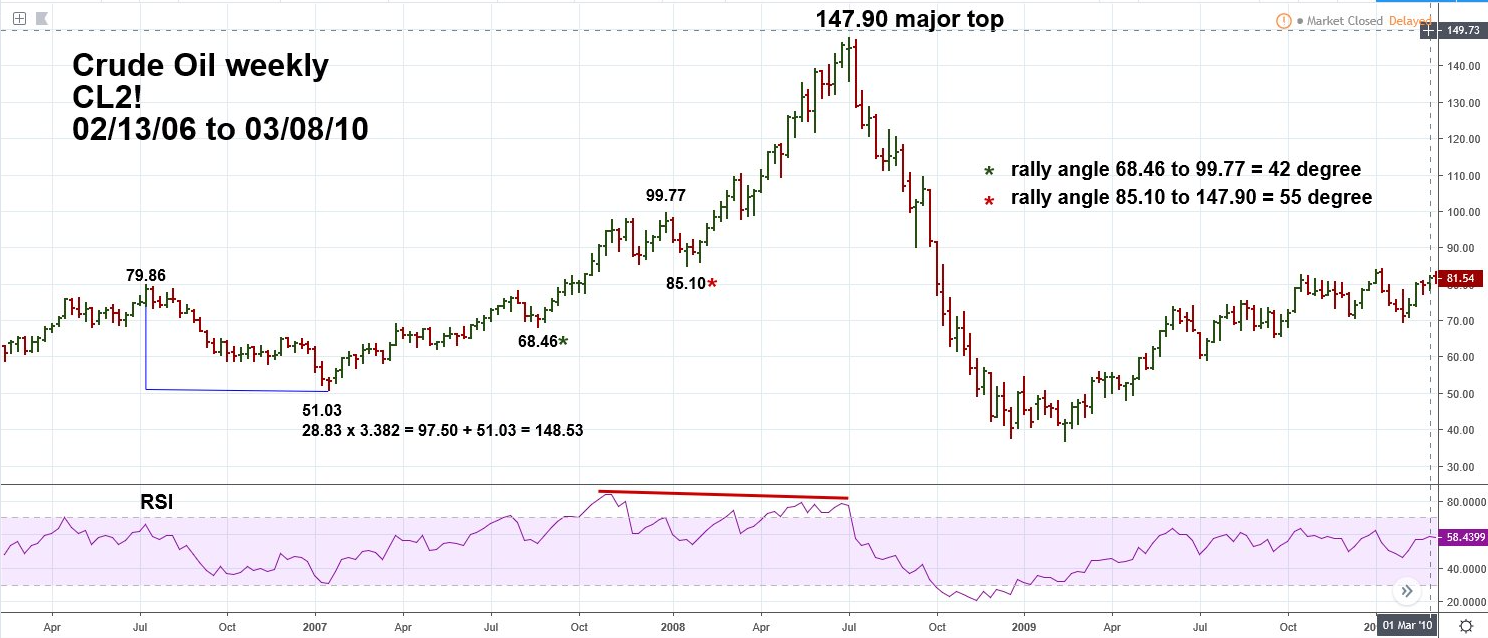
| Crude Oil - 2006 to 2010 Crude Oil's very important top in July 2008 is another example of a Fibonacci projection forecasting a turn. Please see the weekly Crude Oil Futures next continuous contract (CL2!) chart illustrated in Figure 3. The projection was 148.53 with the actual high at 147.90, amazingly close and accompanied by a weekly RSI bearish divergence in the overbought zone. Prior to this peak Crude Oil had been in a relentless rally for six months. It's hard to exit a long position, let alone enter a short position after such an extreme move. Knowledge of Fibonacci projection points lets you know you're at least in the ball park for a potential turn. |
|
| Figure 3. The projection was 148.53 with the actual high at 147.90, amazingly close and accompanied by a weekly RSI bearish divergence in the overbought zone. |
| Graphic provided by: tradingview.com. |
| |
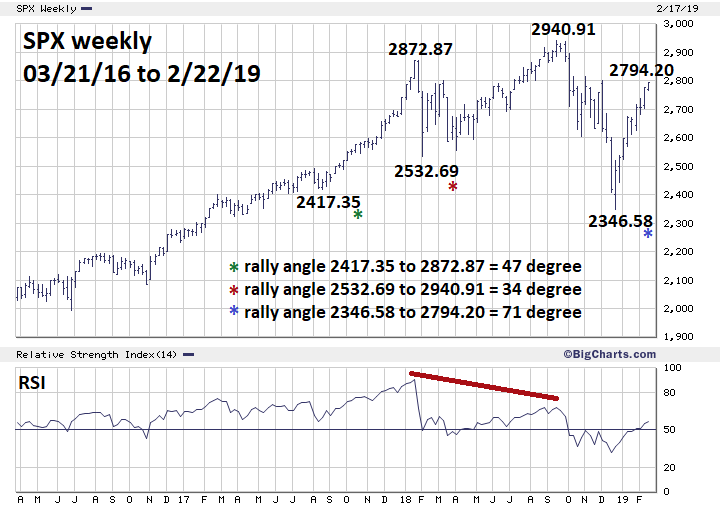
| S&P 500 - 2016 to 2019 The SPX could have a significant peak sometime in 2019. My February 1, 2018 article noted the next significant SPX resistance was at 3047. Calculated by taking the 909.30-point decline of the 2007 to 2009 bear market multiplied by 2.618 which yields 2380.54, added to the March 2009 bottom of 666.79 targets 3047.33. Please see the weekly SPX chart 2016 to 2019 illustrated in Figure 4. Look what's been happening since the late December 2018 bottom; the current rally angle is even steeper than the late 2017 to early 2018 rally. If the SPX keeps climbing at this rate it could reach the low 3000 area in a few weeks. There's, of course, no guarantee the SPX could reach 3000, or even breach the so far all-time high at 2940. Typically, the first rally within a stock bear market will retrace 60 to 90% of the first bear market decline. As of February 22, the SPX is in that zone. Additionally, steep angle rises are a phenomenon not just of late bull markets but also early bear markets — the crowd finally understands that going long is the correct move. |
|
| Figure 4. If the SPX keeps climbing at this rate it could reach the low 3000 area in a few weeks. |
| Graphic provided by: BigCharts.com. |
| |
| S&P 500 - February to April 2019 Since the so far relentless SPX rally began in late December, the longest decline has lasted three trading days with a drop of 3%. From late February to early April 2019, if the SPX declines longer than six trading days and more than 6% it could be the start of something much larger and longer to the downside. Otherwise the SPX will be likely to continue skyrocketing higher. Between January 23 and February 22 (twenty-two trading days) the SPX went from 2612 to 2794 — 182 points. If the SPX maintains this pace it could be just below 3000 by late March 2019. If the SPX can break above 3000 it will be in the lower leeway zone for potentially major resistance at 3047. Great traders are prepared for both bullish and bearish contingencies. If the SPX blasts into the low 3000 area within the next few weeks accompanied by bearish momentum and sentiment be prepared for what could be a historic turn. Further Reading: Frost A.J and Robert Prechter {1985} "Elliott Wave Principle", New Classics Library. Rivest, Mark {2019} "The US Long Wave Revisited" Technical Analysis of Stocks & Commodities, Volume 37: Bonus Issue. |
Independent investment advisor, trader and writer. He has written articles for Technical Analysis of Stocks & Commodities, Traders.com Advantage,Futuresmag.com and, Finance Magnates. Author of website Four Dimension Trading.
| Website: | www.fourdimensiontrading.com |
| E-mail address: | markrivest@gmail.com |
Click here for more information about our publications!
Comments

Request Information From Our Sponsors
- StockCharts.com, Inc.
- Candle Patterns
- Candlestick Charting Explained
- Intermarket Technical Analysis
- John Murphy on Chart Analysis
- John Murphy's Chart Pattern Recognition
- John Murphy's Market Message
- MurphyExplainsMarketAnalysis-Intermarket Analysis
- MurphyExplainsMarketAnalysis-Visual Analysis
- StockCharts.com
- Technical Analysis of the Financial Markets
- The Visual Investor
- VectorVest, Inc.
- Executive Premier Workshop
- One-Day Options Course
- OptionsPro
- Retirement Income Workshop
- Sure-Fire Trading Systems (VectorVest, Inc.)
- Trading as a Business Workshop
- VectorVest 7 EOD
- VectorVest 7 RealTime/IntraDay
- VectorVest AutoTester
- VectorVest Educational Services
- VectorVest OnLine
- VectorVest Options Analyzer
- VectorVest ProGraphics v6.0
- VectorVest ProTrader 7
- VectorVest RealTime Derby Tool
- VectorVest Simulator
- VectorVest Variator
- VectorVest Watchdog