

HOT TOPICS LIST
- MACD
- Fibonacci
- RSI
- Gann
- ADXR
- Stochastics
- Volume
- Triangles
- Futures
- Cycles
- Volatility
- ZIGZAG
- MESA
- Retracement
- Aroon
INDICATORS LIST
LIST OF TOPICS
PRINT THIS ARTICLE
by Mark Rivest
Learn why this aerospace & defense company is a key stock market indicator.
Position: N/A
Mark Rivest
Independent investment advisor, trader and writer. He has written articles for Technical Analysis of Stocks & Commodities, Traders.com Advantage,Futuresmag.com and, Finance Magnates. Author of website Four Dimension Trading.
PRINT THIS ARTICLE
ELLIOTT WAVE
Boeing - King Of All Stocks
03/07/19 04:37:45 PMby Mark Rivest
Learn why this aerospace & defense company is a key stock market indicator.
Position: N/A
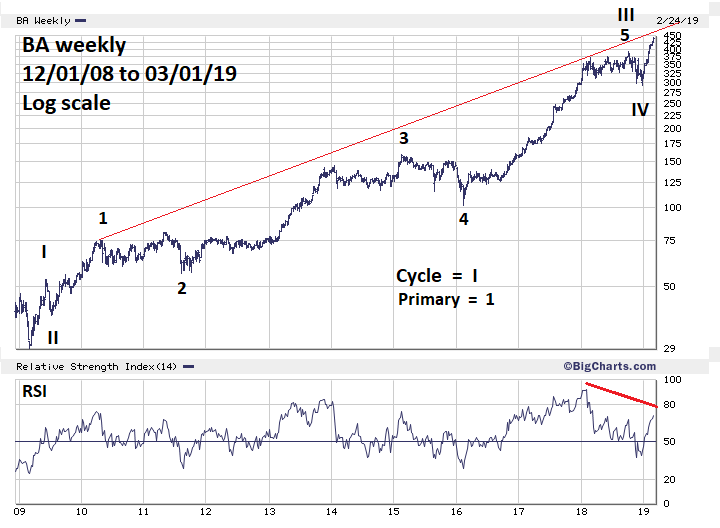
| Since late December 2018 the Dow Jones Industrial Average (DJIA) has been the strongest of the three main US stock indices. As of February 25, the DJIA had retraced 86.4% of its October to December decline and only needs to rally 2.7% to make a new all-time high. The Boeing Company (BA) is the most heavily weighted stock in the DJIA. The direction of BA has a powerful influence on the DJIA which can also affect other US stock indices and possibly the global stock market. Boeing - Long Term The DJIA is a price weighted index, meaning the higher priced stocks have the greatest influence on the index. On March 1, 2019, BA's price was 440.62, highest of the index, with United Health Group Inc. (UNH) at 246.15 in a distant second place. BA accounts for approximately 30% of the DJIA's 2019 gains. Move BA and you could move the market. Please see the weekly BA chart illustrated in Figure 1. BA from its major bottom in 2009 appears to be forming an Elliott extended five wave impulse pattern. Note that BA is below the long-term rising trend line which implies more upside. The significant RSI bearish divergence implies the rally from late 2018 could be the fifth and final wave of the sequence. After the post-December 2018 rally terminates, the next down move could be larger and longer than any BA has had within the last ten years. Usually, within an Elliott five wave impulse pattern there's a relationship between waves one and five. In this case, the termination points of the supposed BA fifth wave from the December 2018 bottom could be calculated. The challenge for the BA long term count is determining what constitutes Cycle wave "I". The peak made in 2010 labeled as Primary wave "1" could also be considered Cycle wave "I", as could the slightly higher top made in 2011. The reasons for choosing the 2009 peak are explained in the next section. |
|
| Figure 1. BA from its major bottom in 2009 appears to be forming an Elliott extended five wave impulse pattern. |
| Graphic provided by: BigCharts.com. |
| |
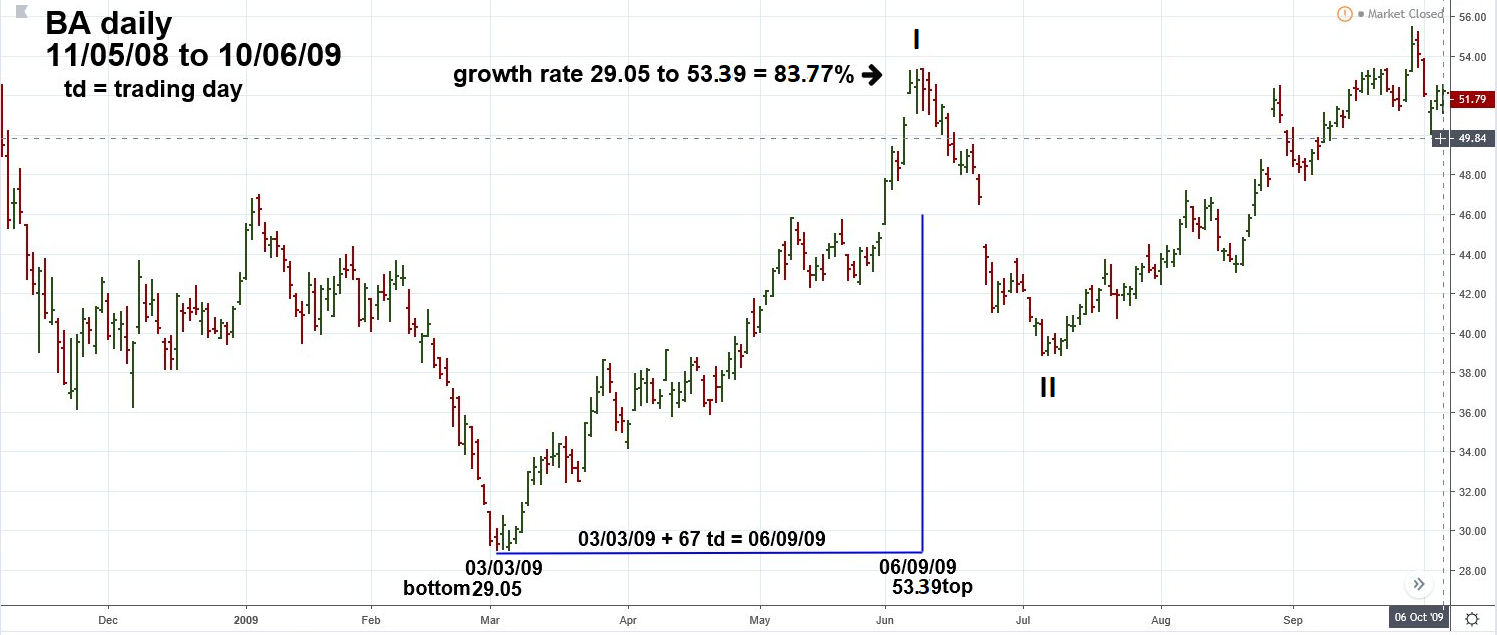
| Boeing - 2008 to 2009 Please see the daily BA chart 2008 to 2009 illustrated in Figure 2. The biggest clue that BA's Cycle wave "I" terminated at 53.59 in June 2009 comes from the subsequent decline to 38.92, labeled as Cycle wave "II". When a stock index or stock completes a bear market there's usually a sharp rally off a deeply oversold bottom. The kick-off rallies typically will have significant retracements of 60 to 90% because the crowd believes the bear market is still alive. The decline into the bottom at 38.92 retraced 59.4% of the kick-off rally. Note on the weekly chart the declines after the 2010 top and 2011 peaks were much shallower. The other factors that suggest Cycle wave "I" terminated in June 2009 are the number of trading days — 67 — and the percentage gain of 83.77%; both could tie into the post December 2018 rally. |
|
| Figure 2. The kick-off rallies typically will have significant retracements of 60 to 90% because the crowd believes the bear market is still alive. |
| Graphic provided by: tradingview.com. |
| |
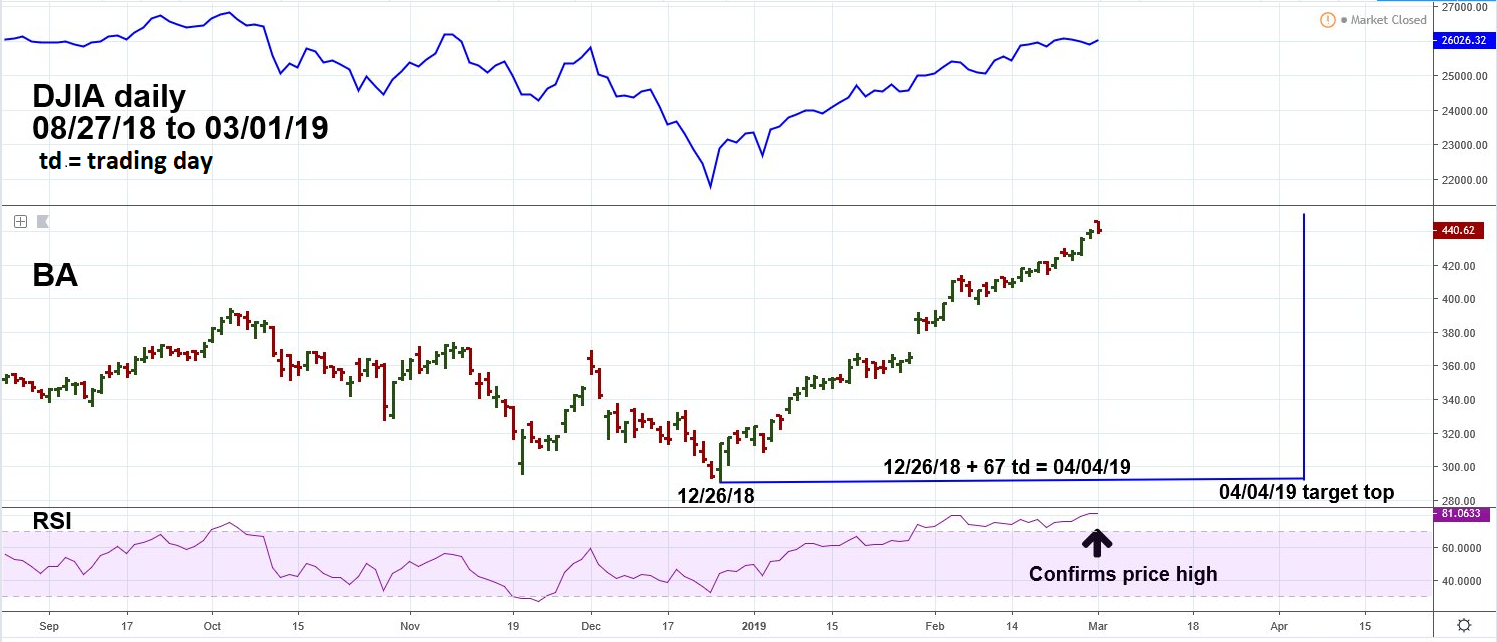
| Boeing - 2018 to 2019 The close connection between BA and DJIA is illustrated in Figure 3. The most common relationship between waves "one" and "five" of an Elliott impulse pattern is equality in price and time. The next most likely relationship is the Fibonacci ratio of .618. The supposed Cycle wave "I" rally lasted 67 trading days multiplied by .618 equals 41 trading days; adding this to the BA December 26, 2018 bottom targets February 27, 2019. Cycle wave "I" rallied 83.77% multiplied by .618 equals 51.77%; added to the December bottom of 292.47 targets 443.88. The recent BA high on March 1 at 446.01 means an important BA top could be in place. However, US stock market seasonal patterns are bullish into early May. Also bullish is that the daily RSI confirmed the recent rally high. Where and when could BA travel to if the most likely relationship of equality of waves "one" and "five "is underway? Adding 67 trading days and 83.77% growth to BA's December 26t bottom of 292.47 targets April 4 and 537.77 as a possible time/price termination point. The Fibonacci extension method explained in my March 1st article "Discovering Market Tops with Fibonacci Extensions" can be used as additional evidence of a possible BA top. The October to December 2018 drop was 101.81 points. 101.81 x 1.618 = 164.72 + 292.47 = 457.19 101.81 x 2.000 = 203.62 + 292.47 = 496.09 101.81 x 2.382 = 242.51 + 292.47 = 534.78 The 2.382 extension target of 534.78 is very close to the equality target of 537.47. |
|
| Figure 3. Adding 67 trading days and 83.77% growth to BA�s December 26 bottom of 292.47 targets April 4 and 537.77 as a possible time/price termination point. |
| Graphic provided by: tradingview.com. |
| |
| Summary Since late 2018 both BA and the DJIA been in a buying panic, corrections have been short and shallow. US stocks are seasonally bullish into early May. Daily RSI for BA confirmed recent price highs — bullish. These factors favor BA continuing to climb until at least April 2019. If at any time in the next several weeks BA has a decline longer than six trading days and/or a decline of more than 6% it could be the first in a long line of dominoes to fall. Further Reading: Frost A.J and Robert Prechter {1985} "Elliott Wave Principle", New Classics Library. Rivest, Mark {2019} "The US Long Wave Revisited" Technical Analysis of Stocks & Commodities, Volume 37: Bonus Issue. |
Independent investment advisor, trader and writer. He has written articles for Technical Analysis of Stocks & Commodities, Traders.com Advantage,Futuresmag.com and, Finance Magnates. Author of website Four Dimension Trading.
| Website: | www.fourdimensiontrading.com |
| E-mail address: | markrivest@gmail.com |
Click here for more information about our publications!
PRINT THIS ARTICLE

Request Information From Our Sponsors
- StockCharts.com, Inc.
- Candle Patterns
- Candlestick Charting Explained
- Intermarket Technical Analysis
- John Murphy on Chart Analysis
- John Murphy's Chart Pattern Recognition
- John Murphy's Market Message
- MurphyExplainsMarketAnalysis-Intermarket Analysis
- MurphyExplainsMarketAnalysis-Visual Analysis
- StockCharts.com
- Technical Analysis of the Financial Markets
- The Visual Investor
- VectorVest, Inc.
- Executive Premier Workshop
- One-Day Options Course
- OptionsPro
- Retirement Income Workshop
- Sure-Fire Trading Systems (VectorVest, Inc.)
- Trading as a Business Workshop
- VectorVest 7 EOD
- VectorVest 7 RealTime/IntraDay
- VectorVest AutoTester
- VectorVest Educational Services
- VectorVest OnLine
- VectorVest Options Analyzer
- VectorVest ProGraphics v6.0
- VectorVest ProTrader 7
- VectorVest RealTime Derby Tool
- VectorVest Simulator
- VectorVest Variator
- VectorVest Watchdog