

HOT TOPICS LIST
- MACD
- Fibonacci
- RSI
- Gann
- ADXR
- Stochastics
- Volume
- Triangles
- Futures
- Cycles
- Volatility
- ZIGZAG
- MESA
- Retracement
- Aroon
INDICATORS LIST
LIST OF TOPICS
PRINT THIS ARTICLE
by Mark Rivest
See what factors could cause its stock to rise dramatically.
Position: Buy
Mark Rivest
Independent investment advisor, trader and writer. He has written articles for Technical Analysis of Stocks & Commodities, Traders.com Advantage,Futuresmag.com and, Finance Magnates. Author of website Four Dimension Trading.
PRINT THIS ARTICLE
BREAKOUTS
Could Tesla be Going to Mars?
01/17/19 04:29:15 PMby Mark Rivest
See what factors could cause its stock to rise dramatically.
Position: Buy
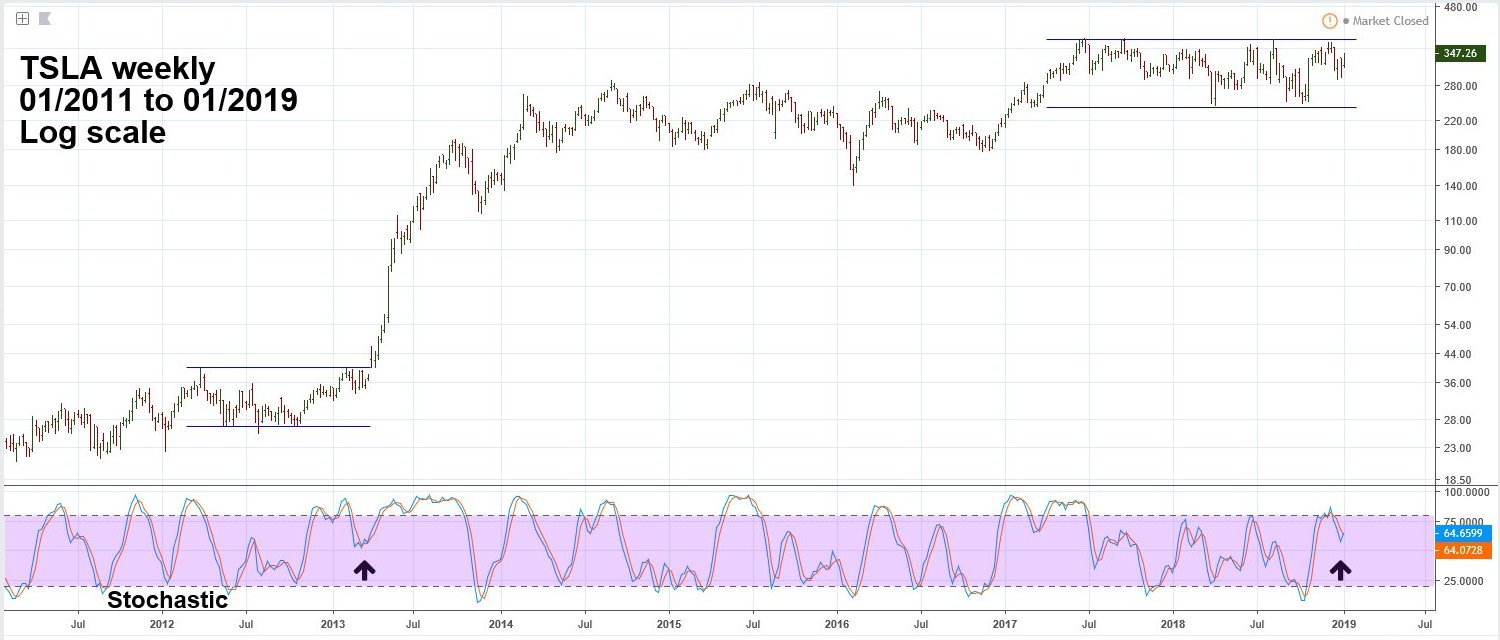
| In the classic 1987 movie "Wall Street" a stock broker urging his client to buy the stock of Blue Star Airlines, states "Its going to Pluto" — meaning really high. Tesla's Co-founder and CEO Elon Musk has a plan for colonizing Mars, which could be a more appropriate celestial destination for Tesla (TSLA). Tesla Long Term Tesla, Inc. develops and sells electrical vehicles and energy generation/storage systems. TSLA started trading at 19.00 in June of 2010, on January 11, 2019, it was 347.26. A rise of over eighteen times in eight years makes it one of the strongest growth stocks in the market, yet it's been stagnant since mid-2017. Please see the TSLA weekly chart illustrated in Figure 1. For nearly two years TSLA has been meandering in a trading range between 389 and 244. While this activity can be frustrating for bulls and bears it's sometimes the prelude to a big move. Note what happened after the basing pattern from 2011 to early 2013. After TSLA broke above the base high at 40 it rallied 190% in less than two months. After six months the stock had climbed 385% before a minor correction began. Note that in the current possible base TSLA has a triple top with prices at: 386.99, 389.61, and 387.46. The logical point for bearish stop loss-buy orders is just above 389.61. Typically when the bulls push above a break out point, bears provide rally fuel. |
|
| Figure 1. Note that in the current possible base TSLA has a triple top with prices at: 386.99, 389.61, and 387.46. |
| Graphic provided by: tradingview.com. |
| |
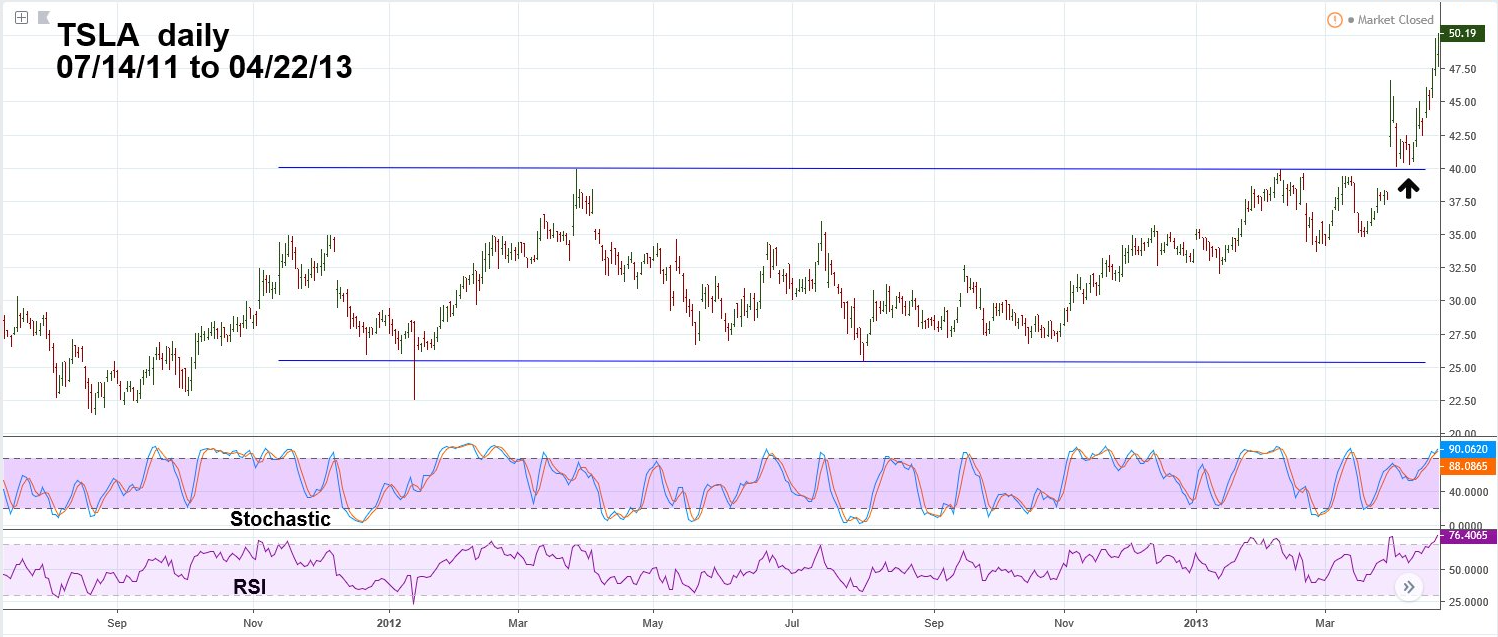
| Tesla 2011 to 2013 Please see the TSLA daily chart illustrated in Figure 2. A close view of the 2011 to 2013 base reveals a double top at 39.95 and 40.00 that proved to be the launch point for a massive rally. Note that after the initial break out on April 1, 2013, TSLA had a brief move down to just above the prior high of 40.00. This occasionally happens after a break out and is known as a "Cup and Handle" formation — discovered by William O'Neil. In this situation the cup begins with the high made in March of 2012 at 39.95. Also note that just prior to the move above 40.00 both the daily Stochastics and RSI had yet to reach overbought levels. It's sometimes difficult to go long when a stock is nearing overbought conditions. However, after the break out momentum can reach and stay overbought for several weeks. Patience is needed in break out situations, don't let overbought momentum keep you out of what could be very large gains. |
|
| Figure 2. A close view of the 2011 to 2013 base reveals a double top at 39.95 and 40.00 that proved to be the launch point for a massive rally. |
| Graphic provided by: tradingview.com. |
| |
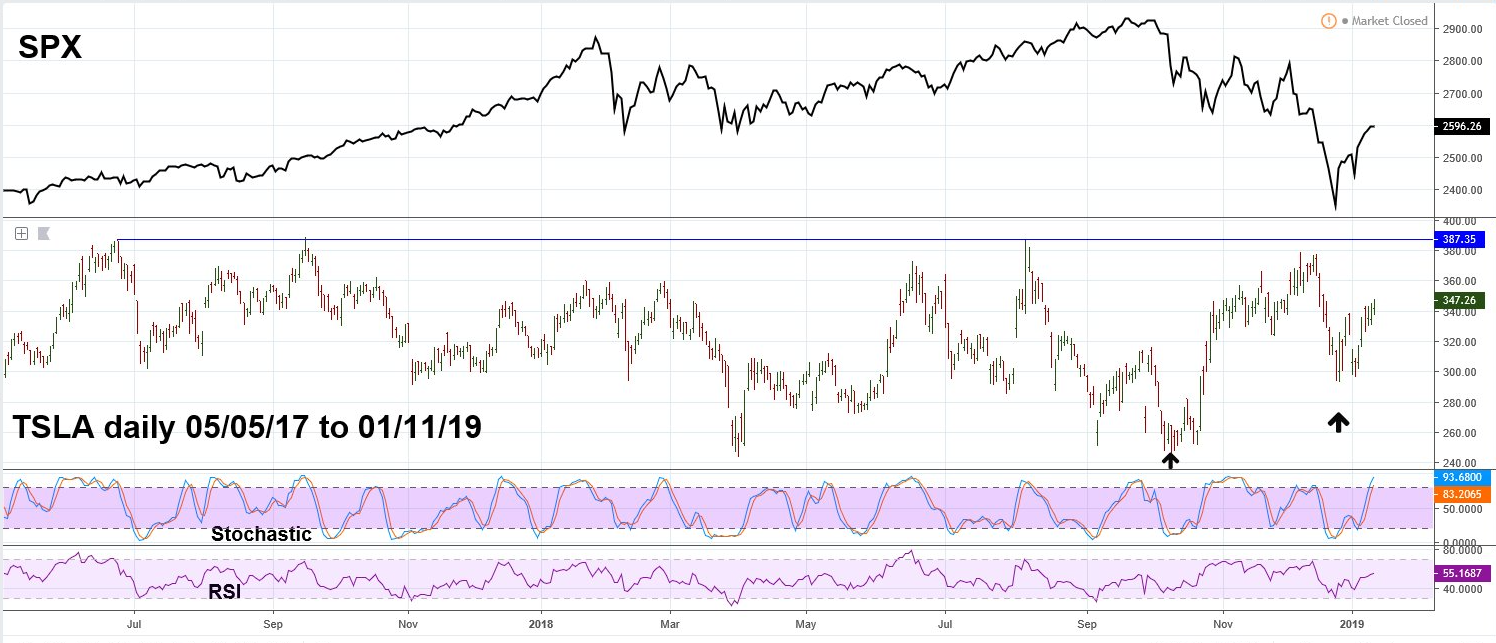
| Tesla and S&P 500 - 2017 to 2019 TSLA underperformed SPX from 2017 to 2018 as it moved sideways vs. SPX making new highs. The situation reversed during the late 2018 market decline. Please see the daily TSLA/SPX chart illustrated in Figure 3. On October 11 the SPX and TSLA both had correction bottoms. The TSLA bottom that day was 249.03, testing the base low made on April 2 at 244.59. After October 11 the SPX stayed in a trading range while TSLA moved higher. At the start of December both continued down and bottomed on December 26. The SPX's late December bottom was significantly below its October 11 bottom, while TSLA held well above its October 11 low. Whatever macro-economic reasons were driving down the broader stock market, they had very little effect on TSLA. You want to go long stocks that are stronger than the broader market. In early 2019 TSLA is clearly stronger than SPX. |
|
| Figure 3. In early 2019 TSLA is clearly stronger than SPX. |
| Graphic provided by: tradingview.com. |
| |
| Tesla Strategy The bottom TSLA made on December 26 at 294.09 and the subsequent high bottom at 297.48 made on January 3 now represent important support and could be used as stop loss levels for traders going long prior to a possible break above resistance at 389.61. Waiting for TSLA to reach an all-time high is the other entry point to go long. A stop buy order at 389.62 just above the current all-time high could be caught in frenzy of short stop loss buy orders being triggered. After the initial break out new longs could jump on the band wagon pushing prices even higher. TSLA's next quarterly report is due February 6, 2019. If a break above 389.61 resistance has not occurred prior to the report, it's possible an upside break could happen soon after the report is issued. If a dynamic break to new TSLA highs occurs, could it repeat the 385% six-month gain made in 2013? Probably not, those types of increases usually come very early in the life of a stock. A more realistic target could be a 50-60% percent gain. My January 3 article "Death of a Bull Market" noted the possibility that the US stock bull market could have ended at the October 2018 top. If a new bear market has begun, usually there's at least a 60% retrace of the first decline. The post December 26, 2018 SPX rally could be a bounce in a developing bear market. If this scenario happens it could, at the very least, keep TSLA in the 244 to 389 trading range. A break below TSLA range low at 244 could open the door for significantly lower prices. Further Reading: O'Neil J. William (2009) "How to Make Money in Stocks", McGraw-Hill |
Independent investment advisor, trader and writer. He has written articles for Technical Analysis of Stocks & Commodities, Traders.com Advantage,Futuresmag.com and, Finance Magnates. Author of website Four Dimension Trading.
| Website: | www.fourdimensiontrading.com |
| E-mail address: | markrivest@gmail.com |
Click here for more information about our publications!
PRINT THIS ARTICLE

Request Information From Our Sponsors
- StockCharts.com, Inc.
- Candle Patterns
- Candlestick Charting Explained
- Intermarket Technical Analysis
- John Murphy on Chart Analysis
- John Murphy's Chart Pattern Recognition
- John Murphy's Market Message
- MurphyExplainsMarketAnalysis-Intermarket Analysis
- MurphyExplainsMarketAnalysis-Visual Analysis
- StockCharts.com
- Technical Analysis of the Financial Markets
- The Visual Investor
- VectorVest, Inc.
- Executive Premier Workshop
- One-Day Options Course
- OptionsPro
- Retirement Income Workshop
- Sure-Fire Trading Systems (VectorVest, Inc.)
- Trading as a Business Workshop
- VectorVest 7 EOD
- VectorVest 7 RealTime/IntraDay
- VectorVest AutoTester
- VectorVest Educational Services
- VectorVest OnLine
- VectorVest Options Analyzer
- VectorVest ProGraphics v6.0
- VectorVest ProTrader 7
- VectorVest RealTime Derby Tool
- VectorVest Simulator
- VectorVest Variator
- VectorVest Watchdog