HOT TOPICS LIST
- MACD
- Fibonacci
- RSI
- Gann
- ADXR
- Stochastics
- Volume
- Triangles
- Futures
- Cycles
- Volatility
- ZIGZAG
- MESA
- Retracement
- Aroon
INDICATORS LIST
LIST OF TOPICS
PRINT THIS ARTICLE
by Andrew Hetherington
Research In Motion (RIMM) is ready to leap forward out of falling wedge patterns that appear on both its daily and monthly charts.
Position: N/A
Andrew Hetherington
Classic Dow Theorist who trades as a pure technician, using pattern recognition.
PRINT THIS ARTICLE
CHART ANALYSIS
Research In Motion and the Falling Wedge
12/18/02 10:40:31 AMby Andrew Hetherington
Research In Motion (RIMM) is ready to leap forward out of falling wedge patterns that appear on both its daily and monthly charts.
Position: N/A
| As hard as it may seem, Research In Motion (RIMM) is poised to jump much higher. Naturally, if the general market conditions don't cooperate then this will be a futile academic exercise. Nonetheless, I expect the Dow to go higher in the very short term before turning south once again. I'm anticipating 9500 on the Dow and I expect most equities to go along for the ride as they have since the Dow hit 7177 in early October. |

|
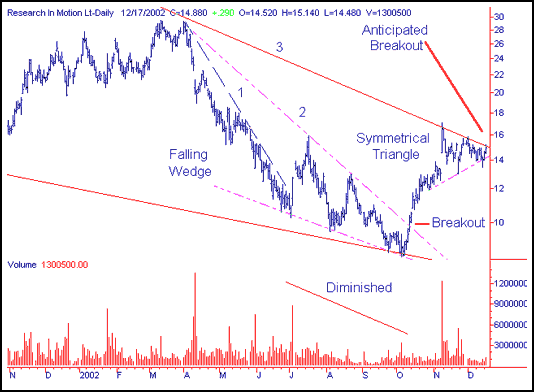
| Figure 1: Research In Motion's daily chart. |
| Graphic provided by: SuperCharts. |
| |
| The daily chart shows a small 1-month symmetrical triangle with slowly diminished volume as required. This triangle is on the verge of breaking out in the $15.00 area. In addition, there is a 4-month falling wedge that has already broken out from the $10.00 area. The third fan line will be broken when the $15.00 line is crossed. This must happen with an increase in activity relative to the recent volumes. If an increase in volume does not happen then it will be an untrustworthy event and should be watched with caution. If it breaks this line, as I suspect, with heavier activity, the direction will be changed from down to up. An upward move will likely go to a minimum of $22.00. |
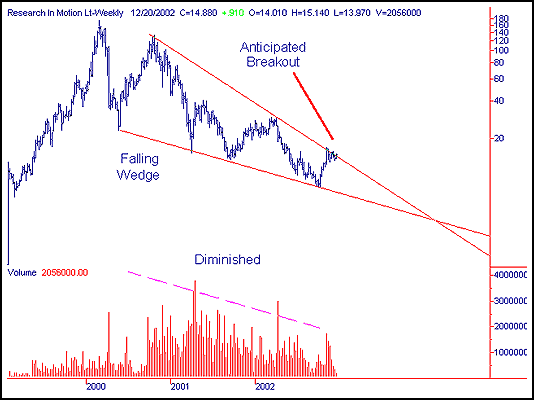
 Figure 2: RIMM's weekly chart. The weekly chart also has a huge 2-year falling wedge pattern. This pattern has not broken topside yet. This resistance area will not be overcome without heavy volume. The prudent trade is to take a long position and use a trailing stop along the bottom symmetrical triangle line in the $14.00 area. This will protect your capital and enable most people to go to work with much less anxiety. Trading within the pattern is always a little tricky but there is the small wedge pattern to help thrust it upwards. |
Classic Dow Theorist who trades as a pure technician, using pattern recognition.
| Toronto, Canada |
Click here for more information about our publications!
Comments
Date: 12/18/02Rank: 5Comment: Mr.Hetherington: Would you explain your comments about the Dow going higher, 9500, in the short term before going south. Is the Dow starting the right shoulder of a H S top which when it crosses the neck line on the way down will be the beginning of the right shoulder bottom of a larger pattern with the left shoulder about July 20th and the head about Oct 7? Would it be possible for you to tell me what chart program you use.
Date: 12/19/02Rank: Comment: Mr. Hetherington: I submitted a question last night on your comments about the Dow. In my rush to get the message off I sent it and then I realized I had not thanked you or even signed off, so ,,thankyou, Tom
E-Mail...tpaulett@idmail.com
Date: 12/29/02Rank: 5Comment:
Date: 12/31/02Rank: Comment: In the wekly chart Rimm is still up over ma 20, Go go!!
But some simetry in the figure doesn t indicate possible breakout
dgue@terra.com

Request Information From Our Sponsors
- VectorVest, Inc.
- Executive Premier Workshop
- One-Day Options Course
- OptionsPro
- Retirement Income Workshop
- Sure-Fire Trading Systems (VectorVest, Inc.)
- Trading as a Business Workshop
- VectorVest 7 EOD
- VectorVest 7 RealTime/IntraDay
- VectorVest AutoTester
- VectorVest Educational Services
- VectorVest OnLine
- VectorVest Options Analyzer
- VectorVest ProGraphics v6.0
- VectorVest ProTrader 7
- VectorVest RealTime Derby Tool
- VectorVest Simulator
- VectorVest Variator
- VectorVest Watchdog
- StockCharts.com, Inc.
- Candle Patterns
- Candlestick Charting Explained
- Intermarket Technical Analysis
- John Murphy on Chart Analysis
- John Murphy's Chart Pattern Recognition
- John Murphy's Market Message
- MurphyExplainsMarketAnalysis-Intermarket Analysis
- MurphyExplainsMarketAnalysis-Visual Analysis
- StockCharts.com
- Technical Analysis of the Financial Markets
- The Visual Investor
