HOT TOPICS LIST
- MACD
- Fibonacci
- RSI
- Gann
- ADXR
- Stochastics
- Volume
- Triangles
- Futures
- Cycles
- Volatility
- ZIGZAG
- MESA
- Retracement
- Aroon
INDICATORS LIST
LIST OF TOPICS
PRINT THIS ARTICLE
by Mark Rivest
An examination of post stock market crash rallies.
Position: N/A
Mark Rivest
Independent investment advisor, trader and writer. He has written articles for Technical Analysis of Stocks & Commodities, Traders.com Advantage,Futuresmag.com and, Finance Magnates. Author of website Four Dimension Trading.
PRINT THIS ARTICLE
MOMENTUM
The Stock Market Crash Ratio - Part Two
10/25/18 04:41:49 PMby Mark Rivest
An examination of post stock market crash rallies.
Position: N/A
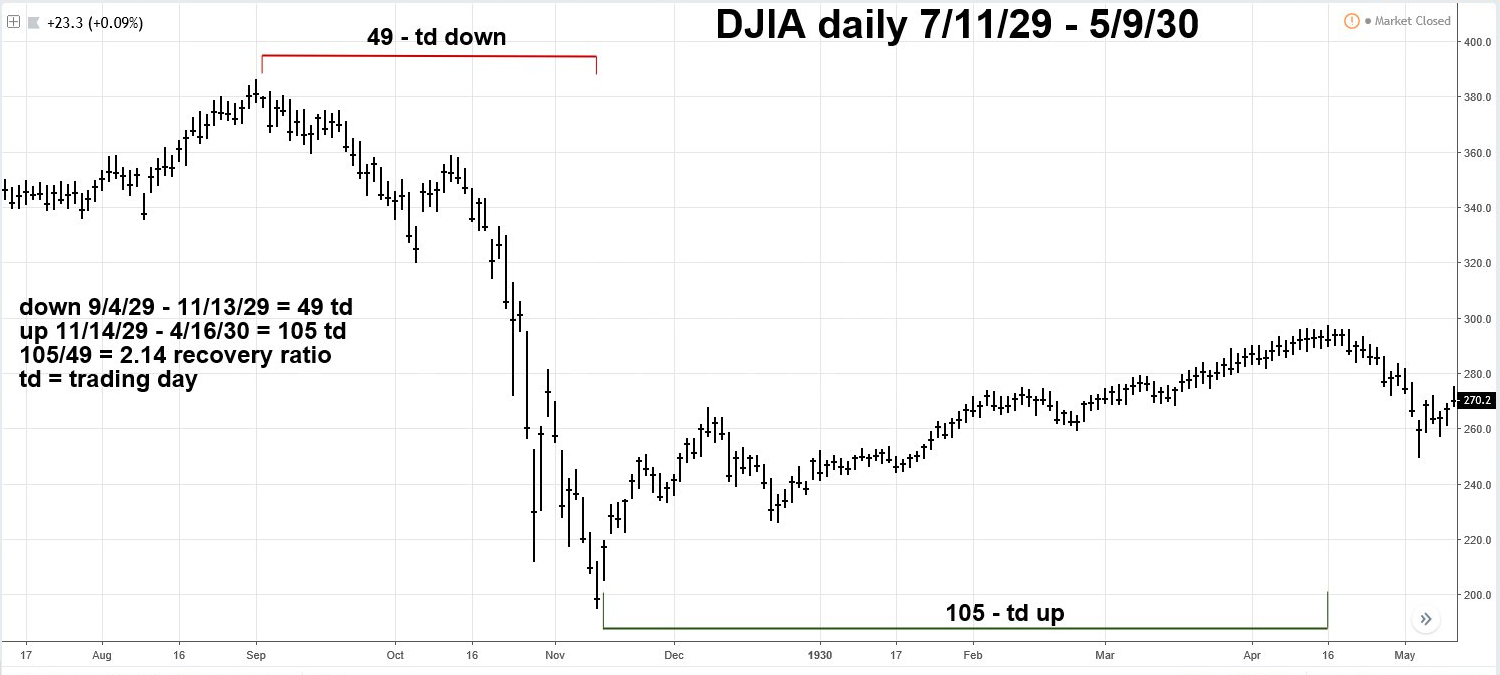
| The speed of a stock market crash, regardless of size, remains in a narrow range. My October 17 article "The Stock Market Crash Ratio" illustrated that the 1929 47.8% decline had a crash ratio of .126. The SPX February 2018 11.8% drop had a crash ratio of .125. This article focuses on the speed of post-crash rallies. Dow Jones Industrial Average 1929-1930 The biggest stock market crash in US history was the September to November 1929 devastating 47.8% drop. The daily Dow Jones Industrial Average (DJIA) chart illustrated in Figure 1 shows a steady rally from November 14, 1929 to April 16, 1930. The rally retraced 51% of the crash, very close to the Fibonacci ratio of .50. The rally was 105 trading days, the crash was 49 trading days for a recovery ratio of 105/49 = 2.14. The rally that terminated in April of 1930 was the biggest bull trap in US history. The highest DJIA closing price in April of 1930 was 294.10. The lowest DJIA closing price in July 1932 was 41.20, a mind blowing 85.9% drop in a little more than two years and two months. | ||||||||||||||||||||||||||||||||||||||||

| ||||||||||||||||||||||||||||||||||||||||
| Figure 1. The rally that terminated in April of 1930 was the biggest bull trap in US history. | ||||||||||||||||||||||||||||||||||||||||
| Graphic provided by: tradingview.com. | ||||||||||||||||||||||||||||||||||||||||
| | ||||||||||||||||||||||||||||||||||||||||
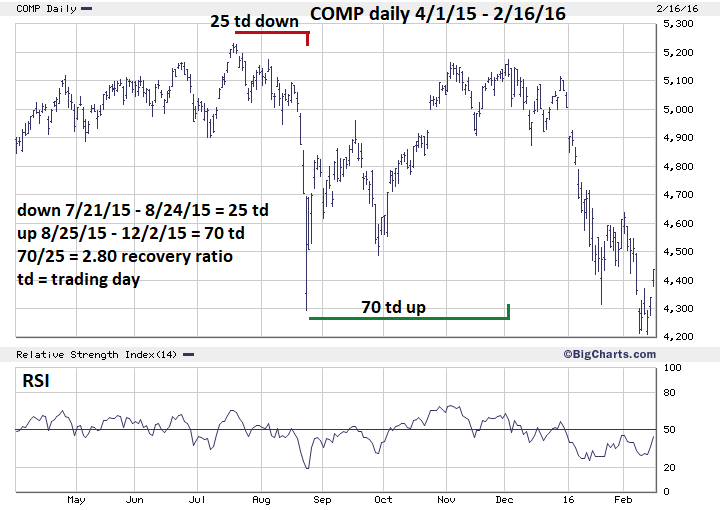
| Nasdaq Composite 2015-2016 In terms of post-crash recovery speed, the Nasdaq Composite (COMP) has the closest recovery ratio to the 1929-1930 DJIA rally. Please see the daily COMP chart illustrated in Figure 2. COMP's July to August decline was 25 trading days, the subsequent rally was 70 trading days for a recovery ratio of 70/25 = 2.8, close to the DJIA rally into April 1930. There was a big difference regarding crash retracement. In this situation there was a 94.1% retrace of the crash. Usually when you see a deep retracement of a sharp decline it means the bears are getting weaker. Most of the time after a deep retracement the bears can only achieve a marginal breach of the last significant bottom. The bears broke the August 2015 crash bottom in February of 2016 by only a small margin before the start of a multi-year bull run. | ||||||||||||||||||||||||||||||||||||||||

| ||||||||||||||||||||||||||||||||||||||||
| Figure 2. The bears broke the August 2015 crash bottom in February of 2016 by only a small margin before the start of a multi – year bull run. | ||||||||||||||||||||||||||||||||||||||||
| Graphic provided by: BigCharts.com. | ||||||||||||||||||||||||||||||||||||||||
| | ||||||||||||||||||||||||||||||||||||||||
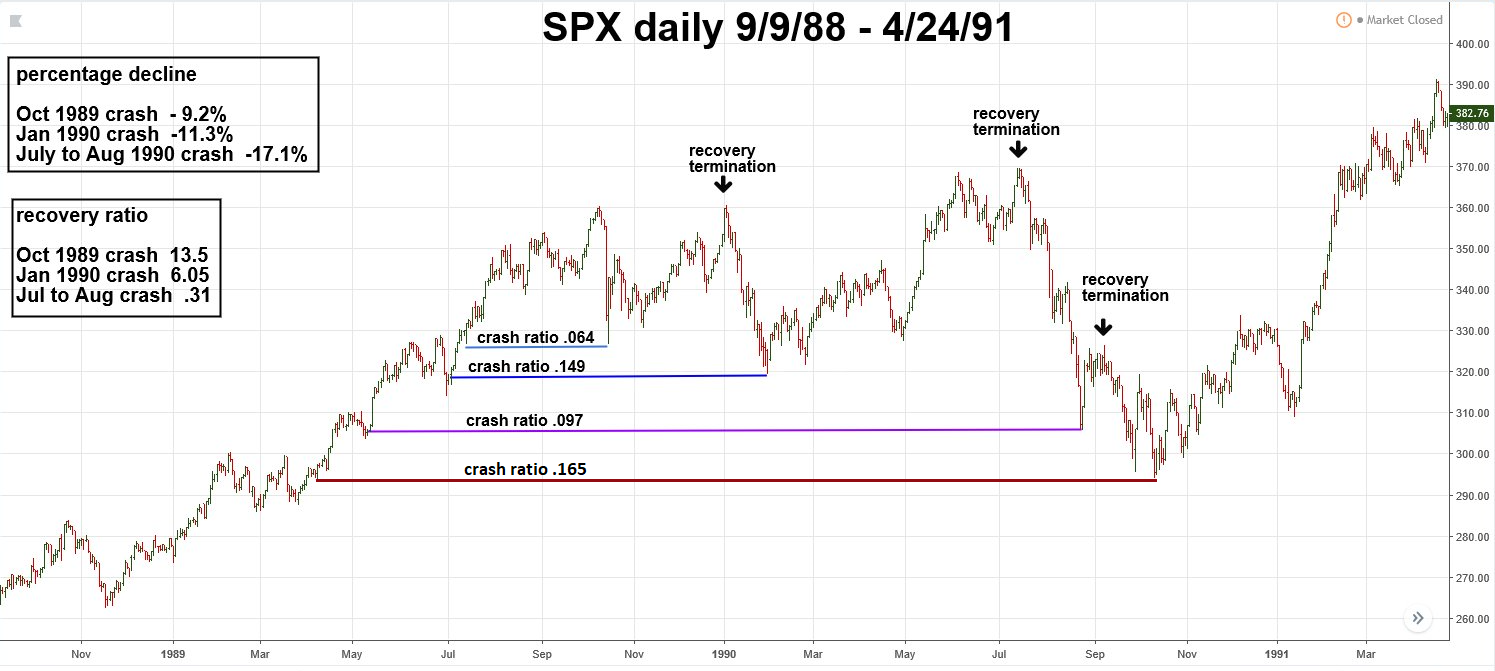
| S&P 500 1989-1990 During a span of only eleven months from 1989 to 1990 the S&P 500 (SPX) had three crashes. Please see the daily SPX chart illustrated in Figure 3. The first crash in October of 1989 was a devastatingly fast 4 trading days producing a tiny crash ratio of .064. Post-crash recovery was 54 trading days and marginally exceeded the pre-crash high. The recovery ratio is 54/4 = 13.5. The second crash began on January 4, 1990 and declined 11.3% vs. the 9.2% drop in 1989. The recovery rally began on January 4, 1990 and lasted 114 trading day and again marginally exceeded the pre-crash top. The recovery ratio is 114/19 = 6.00. There are two ways to examine the third and largest crash of 17.1%. The first is taking a narrow interpretation of the crash with termination point at the August 24, 1990 bottom — shown in Figure 3. This has a crash ratio of .097 which is near the ratio range illustrated in my October 17 article. The second interpretation has the crash ending on the October 11, 1990 bottom, making the crash ratio 63/380 = .165. While this expands the crash ratio range, this expansion is not as great as the August to September 1990 recovery ratio contraction of .31. | ||||||||||||||||||||||||||||||||||||||||

| ||||||||||||||||||||||||||||||||||||||||
| Figure 3. The first crash in October of 1989 was a devastatingly fast 4 trading days producing a tiny crash ratio of .064 | ||||||||||||||||||||||||||||||||||||||||
| Graphic provided by: tradingview.com. | ||||||||||||||||||||||||||||||||||||||||
| | ||||||||||||||||||||||||||||||||||||||||
| Stock Market Crash Data This article and the October 17, 2018 article are the first of what could be several articles dealing with crashes in stocks and other markets. Below is a list of US stock crashes that I've studied.
The study of post-crash recovery speed has not yielded evidence that's helpful predicting recovery time. The recovery ratio range is from 2.14 to 13.50; this is too wide for determining when a post-crash rally could terminate. The crash ratio range is narrow, only .064 to .165. A good analogy to the crash ratio is wind speed required to qualify as a hurricane. If stocks are in a free fall, knowledge of the crash ratio could give a clue as to when the stock storm is terminating. Assuming the most recent crash bottoms of February and October hold, the message of what happens after a stock crash is generally bullish. Of the nine crashes listed only the 1929 was the prelude to a larger bear market. 1/9 = .11 probability the crash is kick off for new bear market. Only three of the nine crashes had their lows marginally breached, 3/9 = .33. Five of the nine crash bottoms held, 5/9 = .55. One final note on the long-forgotten July 1933 micro crash which occurred in the body of the colossal 1932 to 1937 bull market. The 23.5% drop came in only three trading days! Probably one of the biggest and fastest collapses ever. This happened just one year after the bottom of the worst bear market in US history. You can imagine what traders must have been thinking of this collapse, as the country was still in the depths of the depression. Less than four years after the 1933 crash the DJIA more than doubled. Further Reading: Carolan Christopher (1992) "The Spiral Calendar" New Classics Library. | ||||||||||||||||||||||||||||||||||||||||
Independent investment advisor, trader and writer. He has written articles for Technical Analysis of Stocks & Commodities, Traders.com Advantage,Futuresmag.com and, Finance Magnates. Author of website Four Dimension Trading.
| Website: | www.fourdimensiontrading.com |
| E-mail address: | markrivest@gmail.com |
Click here for more information about our publications!
PRINT THIS ARTICLE

|

Request Information From Our Sponsors
- VectorVest, Inc.
- Executive Premier Workshop
- One-Day Options Course
- OptionsPro
- Retirement Income Workshop
- Sure-Fire Trading Systems (VectorVest, Inc.)
- Trading as a Business Workshop
- VectorVest 7 EOD
- VectorVest 7 RealTime/IntraDay
- VectorVest AutoTester
- VectorVest Educational Services
- VectorVest OnLine
- VectorVest Options Analyzer
- VectorVest ProGraphics v6.0
- VectorVest ProTrader 7
- VectorVest RealTime Derby Tool
- VectorVest Simulator
- VectorVest Variator
- VectorVest Watchdog
- StockCharts.com, Inc.
- Candle Patterns
- Candlestick Charting Explained
- Intermarket Technical Analysis
- John Murphy on Chart Analysis
- John Murphy's Chart Pattern Recognition
- John Murphy's Market Message
- MurphyExplainsMarketAnalysis-Intermarket Analysis
- MurphyExplainsMarketAnalysis-Visual Analysis
- StockCharts.com
- Technical Analysis of the Financial Markets
- The Visual Investor
