

HOT TOPICS LIST
- MACD
- Fibonacci
- RSI
- Gann
- ADXR
- Stochastics
- Volume
- Triangles
- Futures
- Cycles
- Volatility
- ZIGZAG
- MESA
- Retracement
- Aroon
INDICATORS LIST
LIST OF TOPICS
PRINT THIS ARTICLE
by Mark Rivest
Price patterns and relative performance hint this stock could be trending down.
Position: Sell
Mark Rivest
Independent investment advisor, trader and writer. He has written articles for Technical Analysis of Stocks & Commodities, Traders.com Advantage,Futuresmag.com and, Finance Magnates. Author of website Four Dimension Trading.
PRINT THIS ARTICLE
STOCKS
Bearish Chart Patterns - The Gap, Inc.
06/12/18 05:31:33 PMby Mark Rivest
Price patterns and relative performance hint this stock could be trending down.
Position: Sell
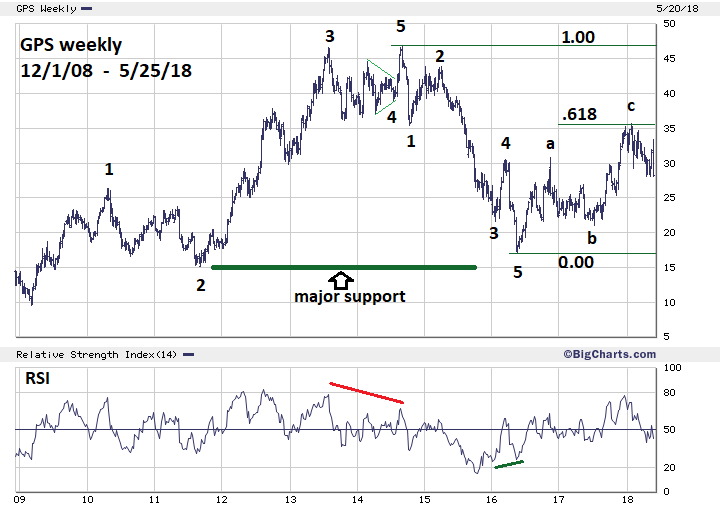
| The Gap, Inc. (GPS) operates as a worldwide apparel retail company. They operate under the Old Navy, Gap, Banana Republic, Athleta, and Intermix brands. Since September of 2014, GPS has significantly underperformed the broader stock market and appears to be in the early phase of its next wave down. GPS weekly chart exhibits very clear signals that it could trend lower. Elliott Wave Patterns Mass psychology creates Elliott wave patterns, the broader the mass mind the clearer the pattern. Therefore, stock market indices make the best vehicles to view the Elliott wave phenomenon. Because each company has its own personality many times it's difficult for Elliott wave patterns to appear in a stock. There are exceptions to the rule, and GPS is one of them. Please see the weekly GPS chart illustrated in Figure 1. The rally from 2009 to 2014 is a text book five wave Elliott pattern. You can clearly see the smaller degree five wave subdivision of wave "1". Third waves are usually the longest, and in this case wave "3" is the longest. Usually the corrective waves two and four are equal in price, and waves "2" and "4" are very close to equal. There's also alternation of the corrective patterns with wave "2" as a Zigzag and wave "4" is a Horizontal Triangle. Wave "5" is a typical post triangle trust. After the September 2014 top at 46.85 the subsequent decline to 17.00 again took the form of a clear Elliott five wave pattern. The rally from the May 2016 bottom appears to be a three-wave correction of close to a .618 retrace of the prior decline. The September 2014 to May 2016 decline was 29.85 points, multiplied by .618 targets 35.44. The actual top made January ,23, 2018 was 35.68 — a near bulls eye hit. Five waves down followed by three waves up strongly implies the next move is down, at least back to 17.00 — the three-wave rally point of origin. |
|
| Figure 1. The rally from 2009 to 2014 is a textbook five wave Elliott pattern. |
| Graphic provided by: BigCharts.com. |
| |
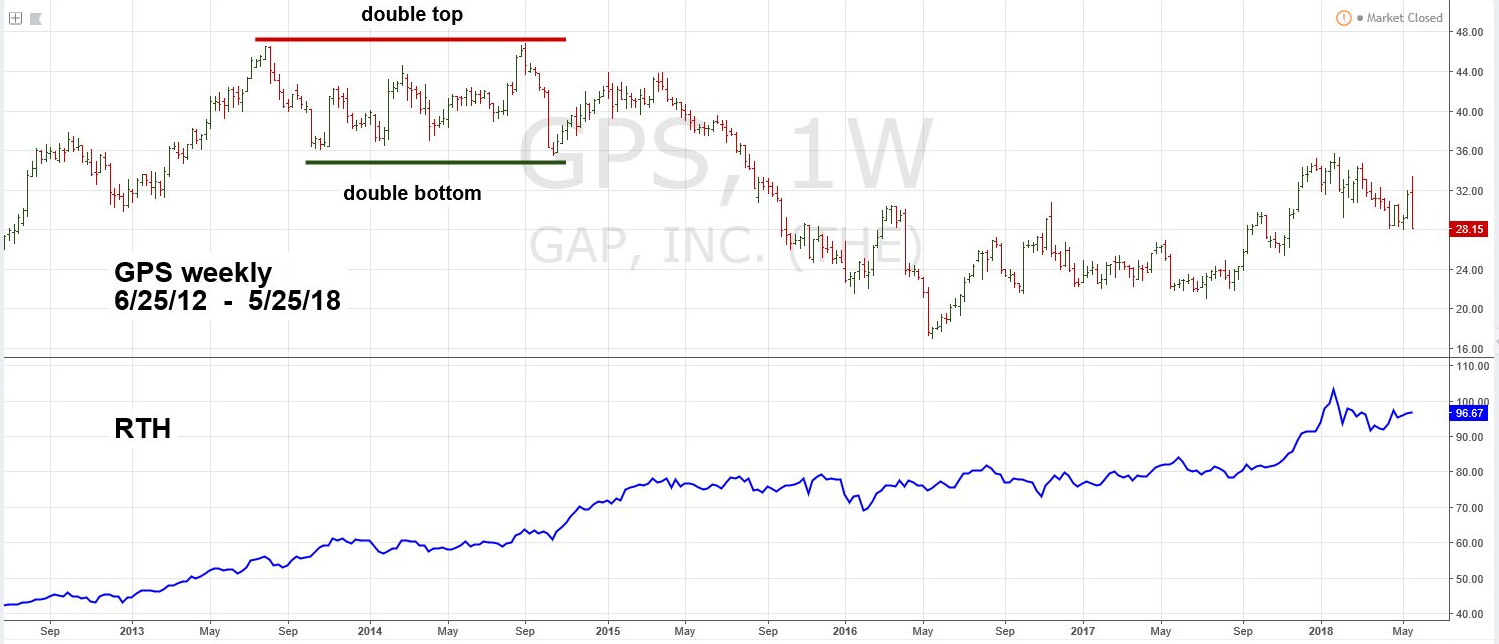
| Relative Performance You want to buy stocks that are stronger than the broader market and sell stocks weaker than the market. The Van Eck Vectors Retail ETF (RTH) tracks a market-cap-weighted index of the 25 largest US-listed companies that derive most of their revenue from retail. GPS is a component of RTH. This ETF is roughly matching the performance of the US stock market. While, as illustrated in Figure 2, GPS is clearly not keeping up with its peers. This tremendous under-performance since September 2014 is enough reason to avoid buying or even holding GPS. Even if you knew nothing about Elliott wave patterns, standard technical analysis gave powerful bearish clues that GPS was headed lower. Note the double tops July 2013 at 46.56 and September 2014 at 46.85. Then a clear, sharp rejection of 46 price area. This decline lasted only lasted seven weeks yet wiped out the entire progress of the prior eleven-month rally. The sharp drop also created a double bottom, with the October 2014 low of 35.46 coming near the October 2013 bottom at 36.13. In August 2015 there was another bearish signal as the double bottom was breached with a break below 35.46. Finally, if you knew nothing about Fibonacci analysis, note the subsequent 2016 to 2018 rally brought GPS back to 35.68 right around the prior double bottom support zone. |
|
| Figure 2. This tremendous under-performance since September 2014 is enough reason to avoid buying, or even holding, GPS. |
| Graphic provided by: tradingview.com. |
| |
| Conclusion My May 24 article "Global Bullish Confirmation" noted that the S&P 500 (SPX) could be in a powerful trust up to a new all-time high by late May or early June. After this writing the SPX has traded in a narrow range between 2700 and 2742. A break above 2742 could trigger a rally of at least 150 points. On May 25, 2018, GPS fell 14.57% because its quarterly earnings were below analysts' expectation. It's possible this is the kick off for the next wave down. If the SPX does rally in the next few weeks, it could slow down or temporarily halt the GPS decline. Watch GPS relative to the SPX — it could provide a good risk/reward ratio to short the stock. If you are long GPS use any move up to start selling. The GPS weekly chart from 2009 to present is a text book example of a stock giving multiple sell signals. This chart should be kept by all traders as a guide to discovering significant turns. Further Reading: Frost A.J and Robert Prechter (1985) "Elliott Wave Principle", New Classics Library. |
Independent investment advisor, trader and writer. He has written articles for Technical Analysis of Stocks & Commodities, Traders.com Advantage,Futuresmag.com and, Finance Magnates. Author of website Four Dimension Trading.
| Website: | www.fourdimensiontrading.com |
| E-mail address: | markrivest@gmail.com |
Click here for more information about our publications!
PRINT THIS ARTICLE

Request Information From Our Sponsors
- StockCharts.com, Inc.
- Candle Patterns
- Candlestick Charting Explained
- Intermarket Technical Analysis
- John Murphy on Chart Analysis
- John Murphy's Chart Pattern Recognition
- John Murphy's Market Message
- MurphyExplainsMarketAnalysis-Intermarket Analysis
- MurphyExplainsMarketAnalysis-Visual Analysis
- StockCharts.com
- Technical Analysis of the Financial Markets
- The Visual Investor
- VectorVest, Inc.
- Executive Premier Workshop
- One-Day Options Course
- OptionsPro
- Retirement Income Workshop
- Sure-Fire Trading Systems (VectorVest, Inc.)
- Trading as a Business Workshop
- VectorVest 7 EOD
- VectorVest 7 RealTime/IntraDay
- VectorVest AutoTester
- VectorVest Educational Services
- VectorVest OnLine
- VectorVest Options Analyzer
- VectorVest ProGraphics v6.0
- VectorVest ProTrader 7
- VectorVest RealTime Derby Tool
- VectorVest Simulator
- VectorVest Variator
- VectorVest Watchdog