HOT TOPICS LIST
- MACD
- Fibonacci
- RSI
- Gann
- ADXR
- Stochastics
- Volume
- Triangles
- Futures
- Cycles
- Volatility
- ZIGZAG
- MESA
- Retracement
- Aroon
INDICATORS LIST
LIST OF TOPICS
PRINT THIS ARTICLE
by Stella Osoba, CMT
Facebook is in the news because of Cambridge Analytica, the privately held data company which harvested data from millions of Facebook users to develop psychographic tools. These tools were then used by the company to target individual voters with stories that would appeal to their emotional biases. By influencing their decision making processes, or as Christopher Wylie the whistleblower and former research director said, their 'inner demons', the firm was able to sway, unknown to the individuals concerned, the way they would eventually vote. Cambridge Analytica effectively weaponized Facebook to undermine Western democracy.
Position: N/A
Stella Osoba, CMT
Stella Osoba is a trader and financial writer. She is a frequent contributor to "Technical Analysis of Stocks and Commodities" magazine and "Traders.com Advantage" as well as other financial publications.
PRINT THIS ARTICLE
TECHNICAL ANALYSIS
Weaponizing Facebook
04/05/18 03:55:09 PMby Stella Osoba, CMT
Facebook is in the news because of Cambridge Analytica, the privately held data company which harvested data from millions of Facebook users to develop psychographic tools. These tools were then used by the company to target individual voters with stories that would appeal to their emotional biases. By influencing their decision making processes, or as Christopher Wylie the whistleblower and former research director said, their 'inner demons', the firm was able to sway, unknown to the individuals concerned, the way they would eventually vote. Cambridge Analytica effectively weaponized Facebook to undermine Western democracy.
Position: N/A
| We often say that the technicals tell you all there is to know about how a stock will perform in the immediate future. Richard Wyckoff used to say that by studying the charts, the market would tell you by its own behavior, what it is going to do. So we'll look at Facebook's charts and try to divine whether by its own action the chart gave any hint of the trouble that was to come. |
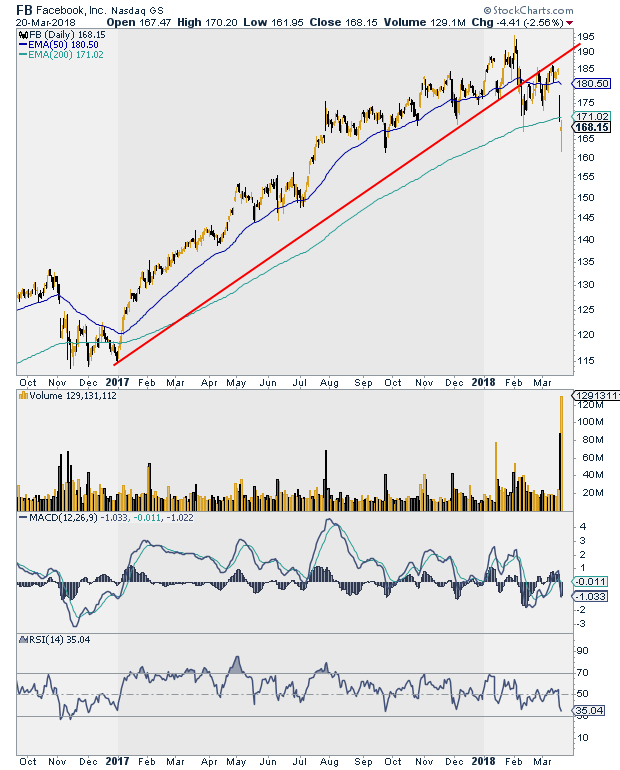
| Figure 1 shows that FB had been in an uptrend through 2017. Any reactions did not break the upward sloping trend line. FB continued making higher highs and higher lows until the first break of the trend line in February 2018. Now had you been long the stock, you would have sat through a pretty gut wrenching time. Any signals of a top were at best subtle. No one would have faulted you for not anticipating the high. |

|
| Figure 1. Daily chart of FB showing long up trend. |
| Graphic provided by: StockCharts.com. |
| |
| But what did the price do next? This is when it becomes important to not only pay attention, but to have the flexibility to reassess. The stunning drop in February did not say business as usual for the up trend. The stock had begun to act wrong. No doubt, there were those who would be hoping that the stock would shake off the unexpected plunge and carry on making higher highs, almost as if the plunge had not happened. But this is where the discipline of technical analysis comes into play. |
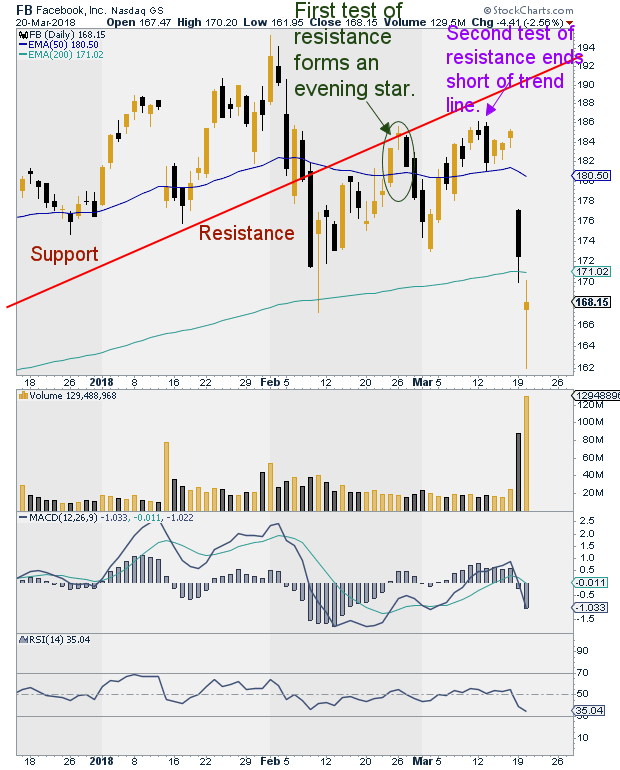
| In Figure 2 we can see what happens as the stock attempts to recover from the February plunge. It rises up to the trend line, finding resistance at former support as the principle of polarity says. The bearish candlestick pattern forming an evening star reversal pattern was another signal that all was not well with the uptrend. The stock reverses to the downside, then makes one more effort to test the up trend line. This time it reverses back to the downside even before it is able to reach the trend line from below. |

|
| |
| Being vigilant to the signals the market was sending us may not have gotten us into the short trade before the scandal erupted, but it certainly should have gotten us out of the long trade in time. Long before the news hit the wires, the chart was telling us that all was not well with this stock. The technicals were certainly weak. Biases can distort our vision so that we see only what we want to see. This is what the people at Cambridge Analytica knew so well, and how they were able to use our information to manipulate us by telling us what we expected to hear and see, information that appealed to our biases. This story therefore is a good example of what we need to aspire to become as traders. Cultivating ourselves to see what is out there, training our minds to recognize and separate our emotions and biases from decision making so that we no longer open ourselves up to manipulation and control by others. And so that we can see the signals the market is sending us and trade, not from our fears and hopes, but from the clarity we acquire by judging the market by its own action. |
Stella Osoba is a trader and financial writer. She is a frequent contributor to "Technical Analysis of Stocks and Commodities" magazine and "Traders.com Advantage" as well as other financial publications.
| E-mail address: | stellaosoba@gmail.com |
Click here for more information about our publications!
PRINT THIS ARTICLE

Request Information From Our Sponsors
- StockCharts.com, Inc.
- Candle Patterns
- Candlestick Charting Explained
- Intermarket Technical Analysis
- John Murphy on Chart Analysis
- John Murphy's Chart Pattern Recognition
- John Murphy's Market Message
- MurphyExplainsMarketAnalysis-Intermarket Analysis
- MurphyExplainsMarketAnalysis-Visual Analysis
- StockCharts.com
- Technical Analysis of the Financial Markets
- The Visual Investor
- VectorVest, Inc.
- Executive Premier Workshop
- One-Day Options Course
- OptionsPro
- Retirement Income Workshop
- Sure-Fire Trading Systems (VectorVest, Inc.)
- Trading as a Business Workshop
- VectorVest 7 EOD
- VectorVest 7 RealTime/IntraDay
- VectorVest AutoTester
- VectorVest Educational Services
- VectorVest OnLine
- VectorVest Options Analyzer
- VectorVest ProGraphics v6.0
- VectorVest ProTrader 7
- VectorVest RealTime Derby Tool
- VectorVest Simulator
- VectorVest Variator
- VectorVest Watchdog
