HOT TOPICS LIST
- MACD
- Fibonacci
- RSI
- Gann
- ADXR
- Stochastics
- Volume
- Triangles
- Futures
- Cycles
- Volatility
- ZIGZAG
- MESA
- Retracement
- Aroon
INDICATORS LIST
LIST OF TOPICS
PRINT THIS ARTICLE
by Koos van der Merwe
There are a few shares that simply move up and up and up. Below are two shares one should keep an eye on.
Position: Sell
Koos van der Merwe
Has been a technical analyst since 1969, and has worked as a futures and options trader with First Financial Futures in Johannesburg, South Africa.
PRINT THIS ARTICLE
TECHNICAL ANALYSIS
Two Shares To Watch
10/05/17 03:25:25 PMby Koos van der Merwe
There are a few shares that simply move up and up and up. Below are two shares one should keep an eye on.
Position: Sell
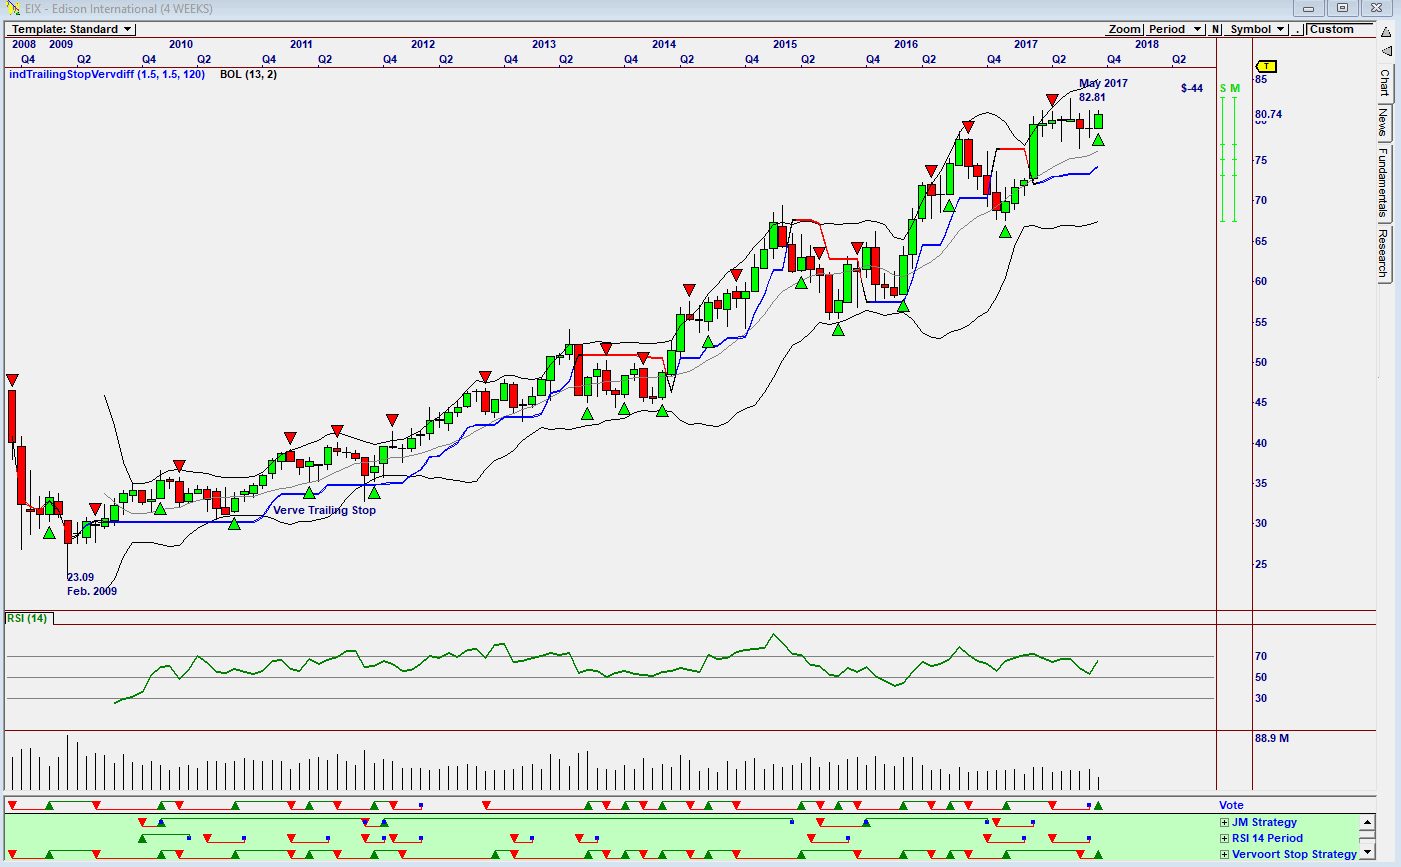
| The chart in Figure 1 is a monthly Omnitrader chart of Edison International showing how the price moved up from a low of $23.09 in February 2009 to a high of $82.81 by May 2017. Edison International is a public utility holding company based in Rosemead, California. Edison is one of the nation's largest electric utilities companies serving a population of nearly 15 million customers. The chart shows that a buy signal has been given on the Vote line based on the Vervoort Stop strategy, suggesting that the share price could move higher. However, the RSI-14 is at overbought levels, suggesting caution. |

|
| Figure 1. Monthly Omnitrader chart suggesting a buy. |
| Graphic provided by: Omnitrader. |
| |
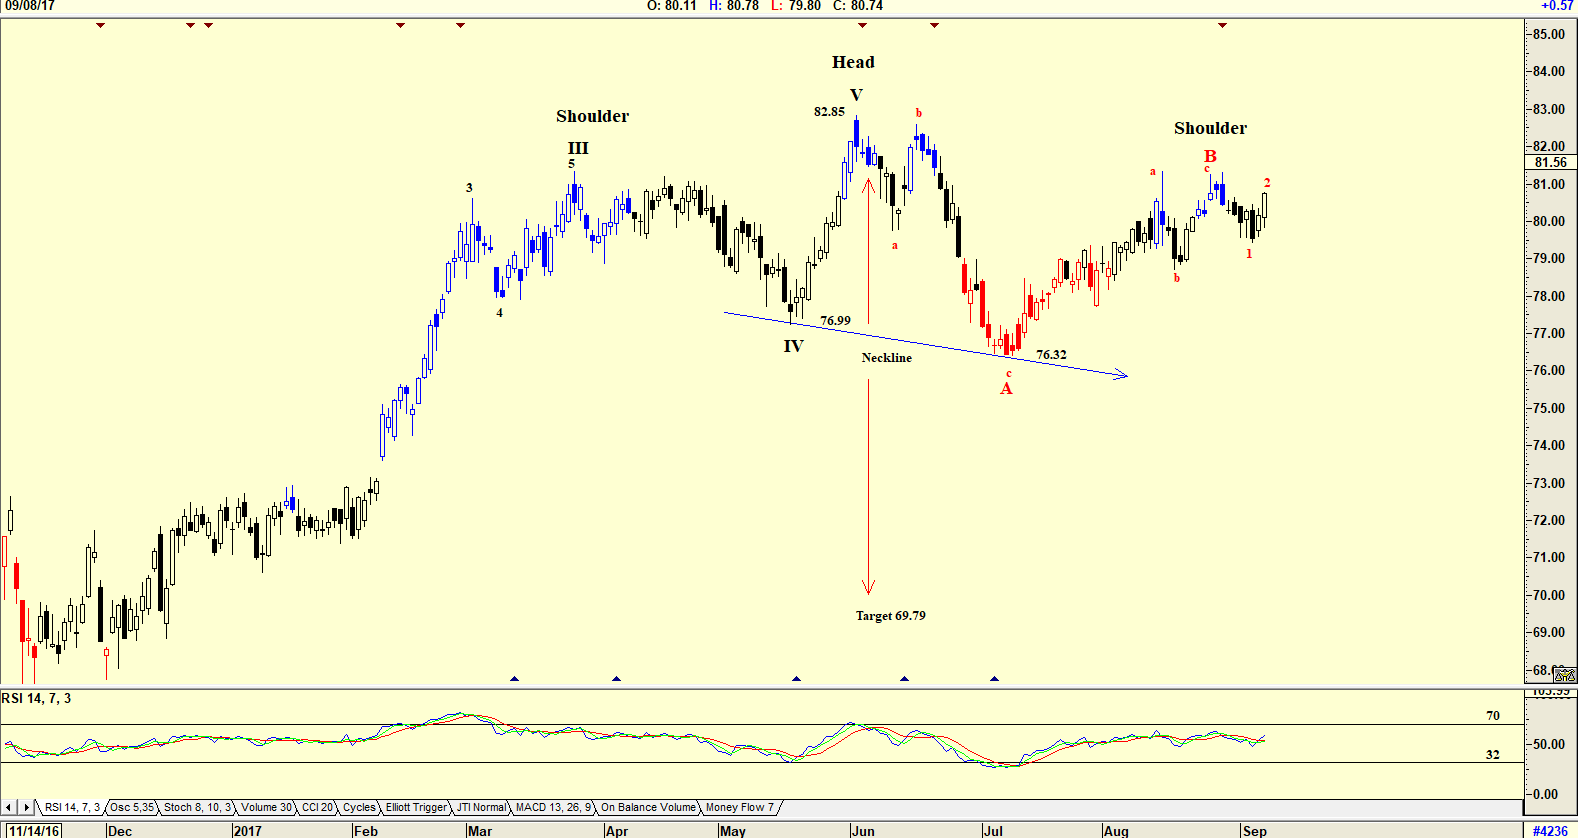
| The chart in Figure 2 is a daily chart showing an Elliott wave count suggesting that the share price could be completing a Wave B correction, and should fall below $76.32, the low of WAVE A. The share price could be tracing a Head-and-Shoulder formation, and if it falls below the neckline, it would fall to $69.79 (82.85 - 76.32 =6.53. 76.32 - 6.53 = 69.79). Do note the RSI Indicator which is trending up but is close to the overbought horizontal line. |

|
| Figure 2. Daily chart suggesting a head-and-shoulder formation. |
| Graphic provided by: AdvancedGET. |
| |
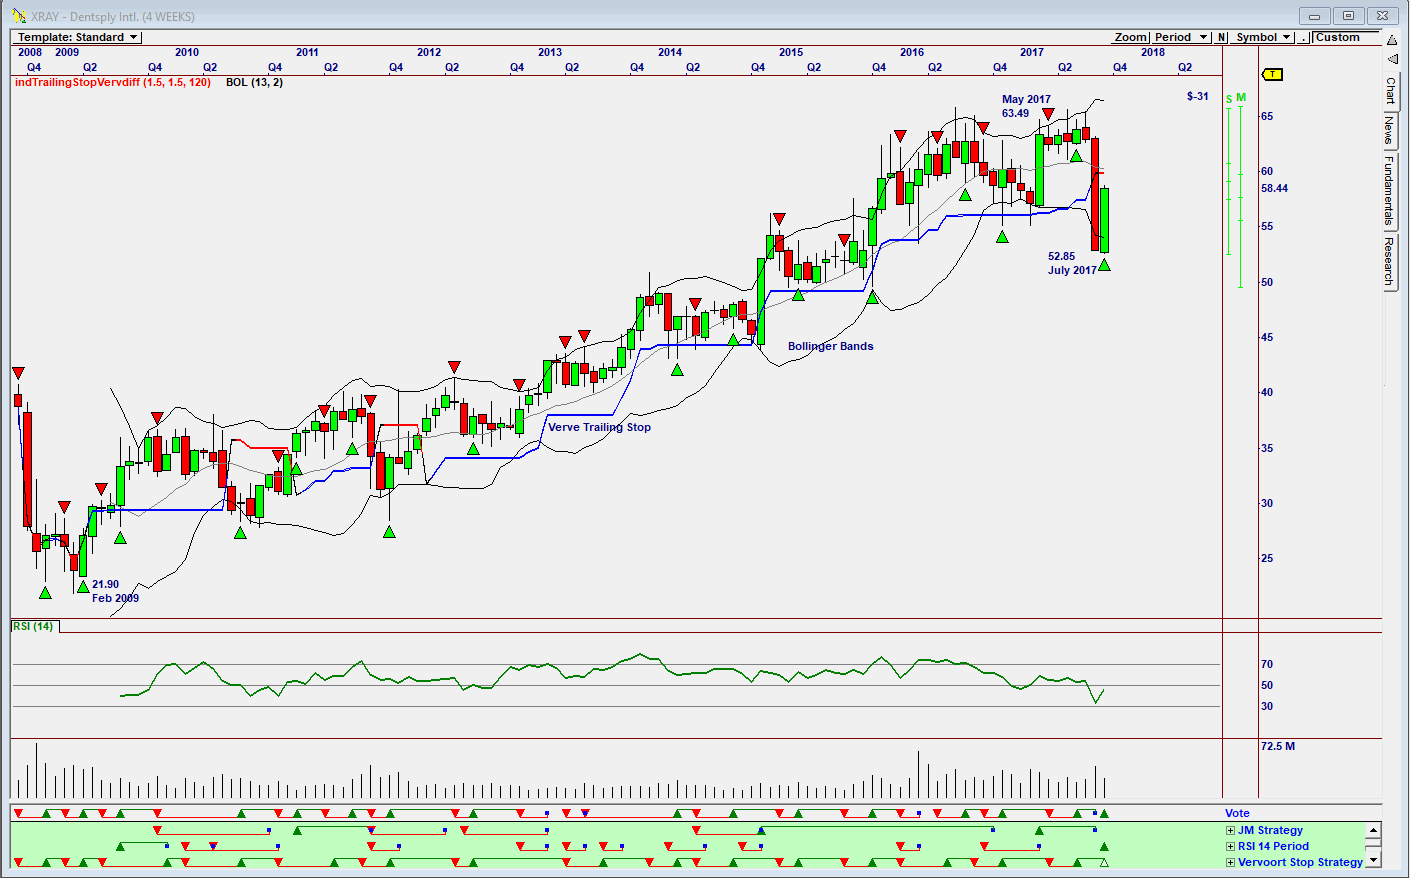
| Another share which caught my attention after Friday, September 8 results is Dentsply Sirona International. The company is a dental care company, helping dental professionals in over 120 countries (factories in 21 countries) deliver dental care. The chart in Figure 1 is a monthly Omnitrader chart showing how the share price rose from a low of $21.90 in February 2009 to a high of $63.49 by May 2017. The chart shows how the price dropped strongly in July 2017 to a low of $52.85. The chart also suggests a buy signal as the share price rose to its present level of $58.44 based on the Vervoort and RSI-14 strategies. Do note the RSI indicator which is at a buy level. |

|
| Figure 3. Omnutrader monthly chart suggesting a buy. |
| Graphic provided by: Omnitrader. |
| |
| Yes, there are many shares out there that one should keep an eye on, shares that are correcting as America is hammered by storms costing the country billions of dollars in repairs, money that the President would have liked to use to build a Mexico wall. Yes, also remember that September is well known for market corrections, and is usually a month where traders, returning to their desks after the Summer holidays, spend their time analyzing the market and preparing investment decisions. So, the answer is research, research and more research. Look for those stocks you would like to own for the future, but caution prevails. My previous article, A Look At Nividia Corp., above shows the two systems I personally use to find the winners. |

|
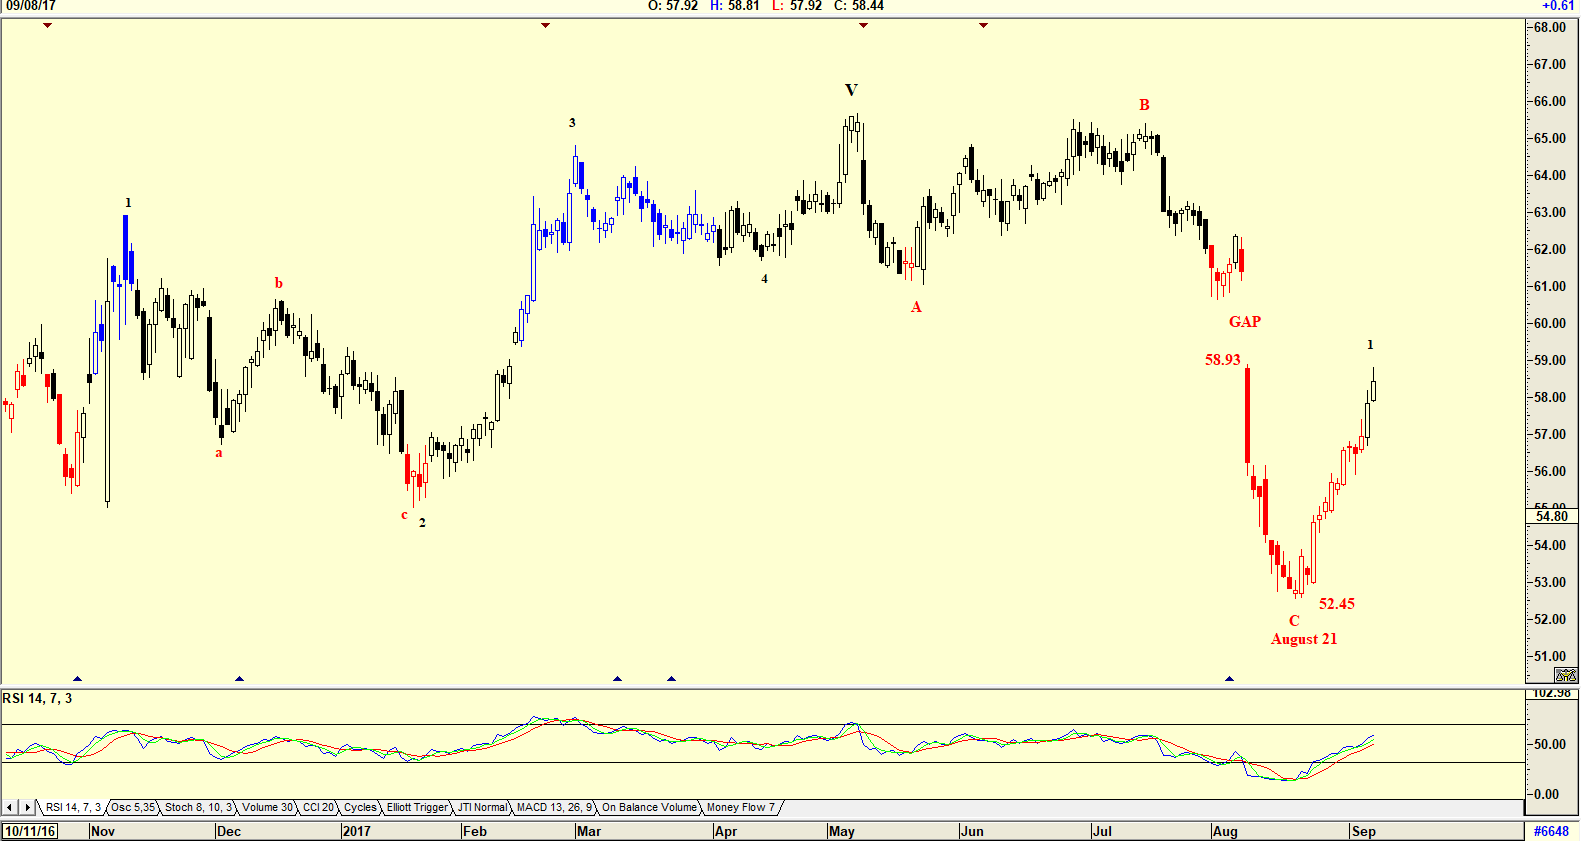
| Figure 4. Daily Elliott wave chart. |
| Graphic provided by: AdvancedGET. |
| |
Has been a technical analyst since 1969, and has worked as a futures and options trader with First Financial Futures in Johannesburg, South Africa.
| Address: | 3256 West 24th Ave |
| Vancouver, BC | |
| Phone # for sales: | 6042634214 |
| E-mail address: | petroosp@gmail.com |
Click here for more information about our publications!
Comments
Date: 10/05/17Rank: 4Comment:

|

Request Information From Our Sponsors
- StockCharts.com, Inc.
- Candle Patterns
- Candlestick Charting Explained
- Intermarket Technical Analysis
- John Murphy on Chart Analysis
- John Murphy's Chart Pattern Recognition
- John Murphy's Market Message
- MurphyExplainsMarketAnalysis-Intermarket Analysis
- MurphyExplainsMarketAnalysis-Visual Analysis
- StockCharts.com
- Technical Analysis of the Financial Markets
- The Visual Investor
- VectorVest, Inc.
- Executive Premier Workshop
- One-Day Options Course
- OptionsPro
- Retirement Income Workshop
- Sure-Fire Trading Systems (VectorVest, Inc.)
- Trading as a Business Workshop
- VectorVest 7 EOD
- VectorVest 7 RealTime/IntraDay
- VectorVest AutoTester
- VectorVest Educational Services
- VectorVest OnLine
- VectorVest Options Analyzer
- VectorVest ProGraphics v6.0
- VectorVest ProTrader 7
- VectorVest RealTime Derby Tool
- VectorVest Simulator
- VectorVest Variator
- VectorVest Watchdog
