HOT TOPICS LIST
- MACD
- Fibonacci
- RSI
- Gann
- ADXR
- Stochastics
- Volume
- Triangles
- Futures
- Cycles
- Volatility
- ZIGZAG
- MESA
- Retracement
- Aroon
INDICATORS LIST
LIST OF TOPICS
PRINT THIS ARTICLE
by Koos van der Merwe
Looking for a technical analysis indicator that gives good returns can be a pain. Here is one that is a definite winner.
Position: Buy
Koos van der Merwe
Has been a technical analyst since 1969, and has worked as a futures and options trader with First Financial Futures in Johannesburg, South Africa.
PRINT THIS ARTICLE
MOVING AVERAGES
A Look At Nividia Corp.
09/28/17 03:54:14 PMby Koos van der Merwe
Looking for a technical analysis indicator that gives good returns can be a pain. Here is one that is a definite winner.
Position: Buy
| There are many, and I mean many, technical indicators available to analyze the market. Finding one that suits you can be difficult. Many years ago I met a lady (I will not mention her name) who told me, "The strategy I use has been very kind to me over the years." I have written her strategy with a few alterations to make it even better in a program I run. I must say that I am very happy with it, and it has produced above average results so far. The charts below show the strategy results on Nividia Corporation, an American technology company that designs graphics processing units for gaming and professional markets, as well as chips for autonomous robots, drones and cars. On August 10, the company's share fell on data center revenue. The shares were down 6.6% to $153.87 after rising 181% over the past year — the strongest performance across the benchmark S&P 500 index. Since then the shares have recovered as shown on the charts below. Without looking at the fundamentals, but purely at the technicals, is Nividia a share that should be held in a portfolio for the long term or short term? That is a decision based on technical analysis. |

|
| Figure 1. Weekly chart of Nividia. |
| Graphic provided by: Omnitrader. |
| |
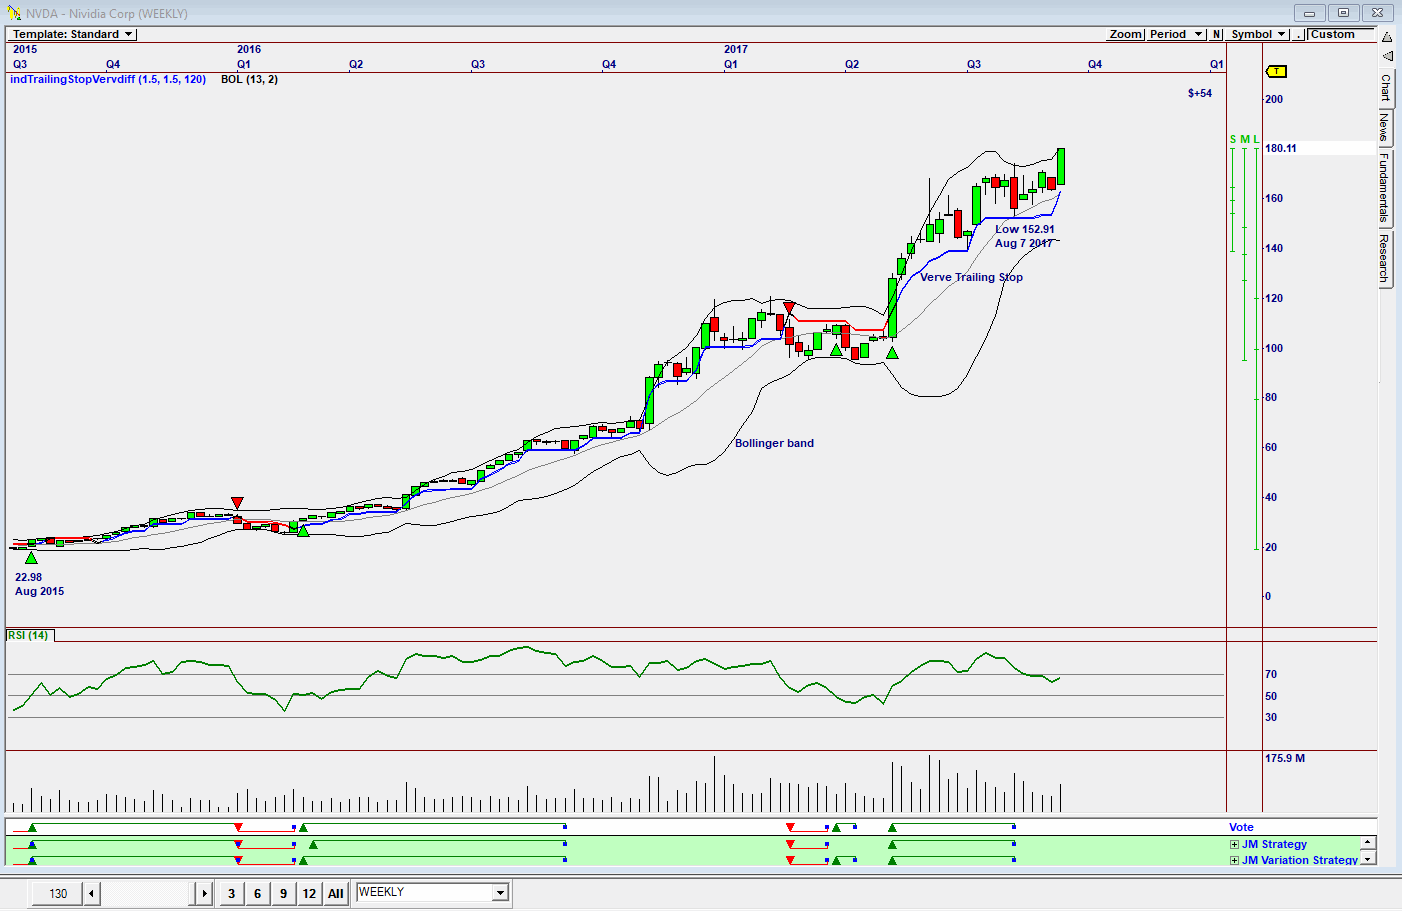
| The chart in Figure 1 is a weekly chart of Nividia Corp showing how the share price has risen strongly after a buy was given in August 2015 when the share price was $22.98. The buy signal given on the Vote line is based on the two strategies shown below the vote line. The JM Strategy is a 15-period simple moving average offset by 2% positive and 2% negative. A buy signal is given when the share price breaks above the upper band and a sell signal when it breaks below the lower band. The JM Variation strategy shown has the simple moving average offset by 1.8% positive, giving an earlier buy signal. The sell signal in both strategies is suggested by a move below the Verve stop loss indicator shown on the chart. On August 7, 2017, as shown on the chart, the share was stopped out as the share price fell to test the Verve trailing stop. Do note that the RSI Indicator only gave a sell signal 3 weeks later. |

|
| Figure 2. Daily chart of Nividia. |
| Graphic provided by: Omnitrader. |
| |
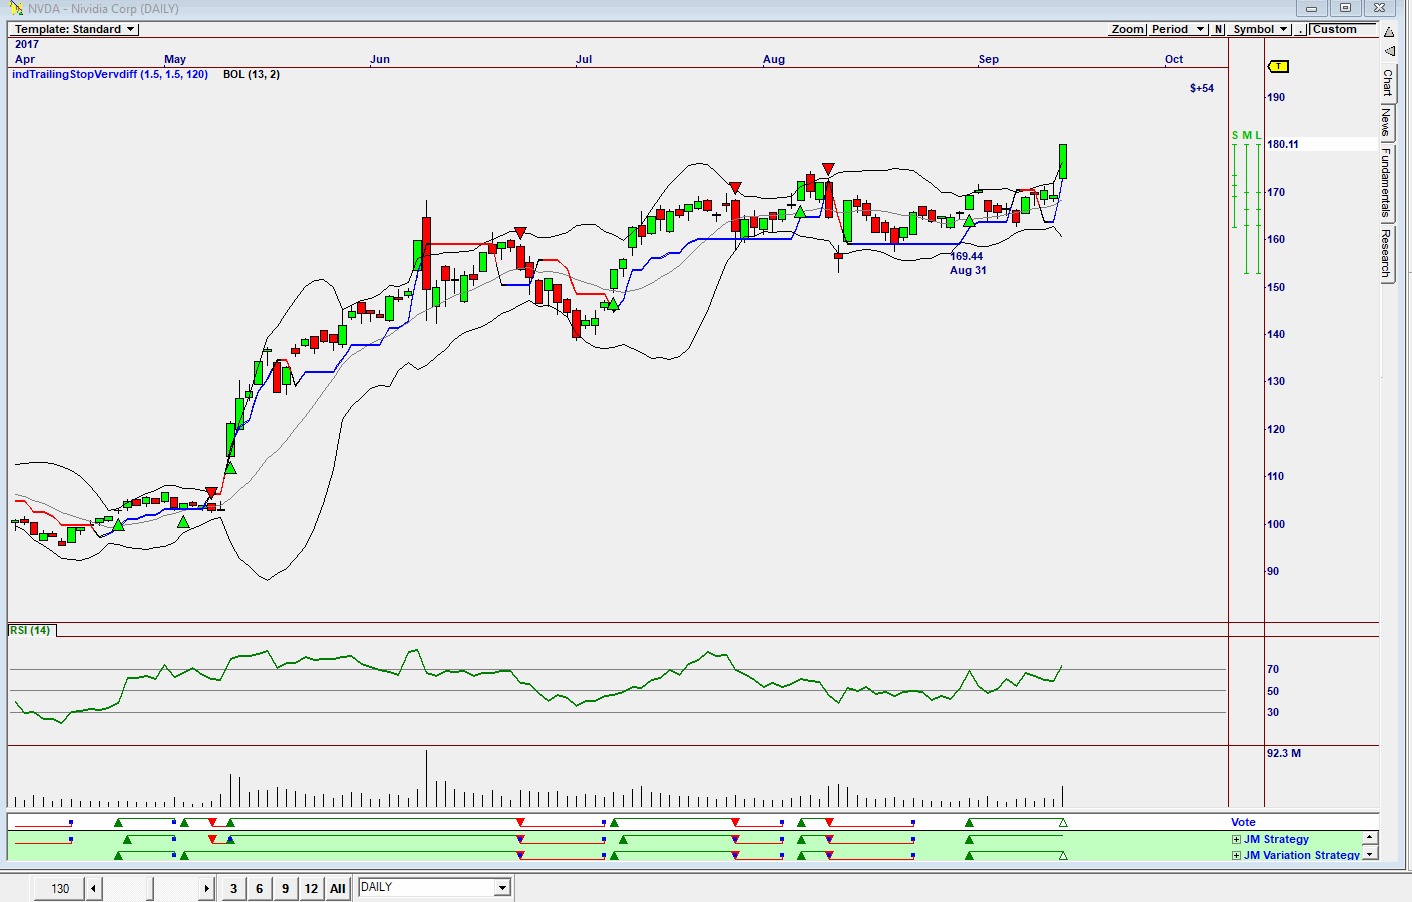
| Looking at a daily chart in Figure 2 a buy signal was given on August 31 when the share price was $169.44. With the share price at $180.11 on September 15, the signal was a good buy. Looking back at chart history in the Vote line, one can see that all the Vote signal buys since April have been profitable. |

|
| Figure 3. Daily chart of Apple. |
| Graphic provided by: Omnitrader. |
| |
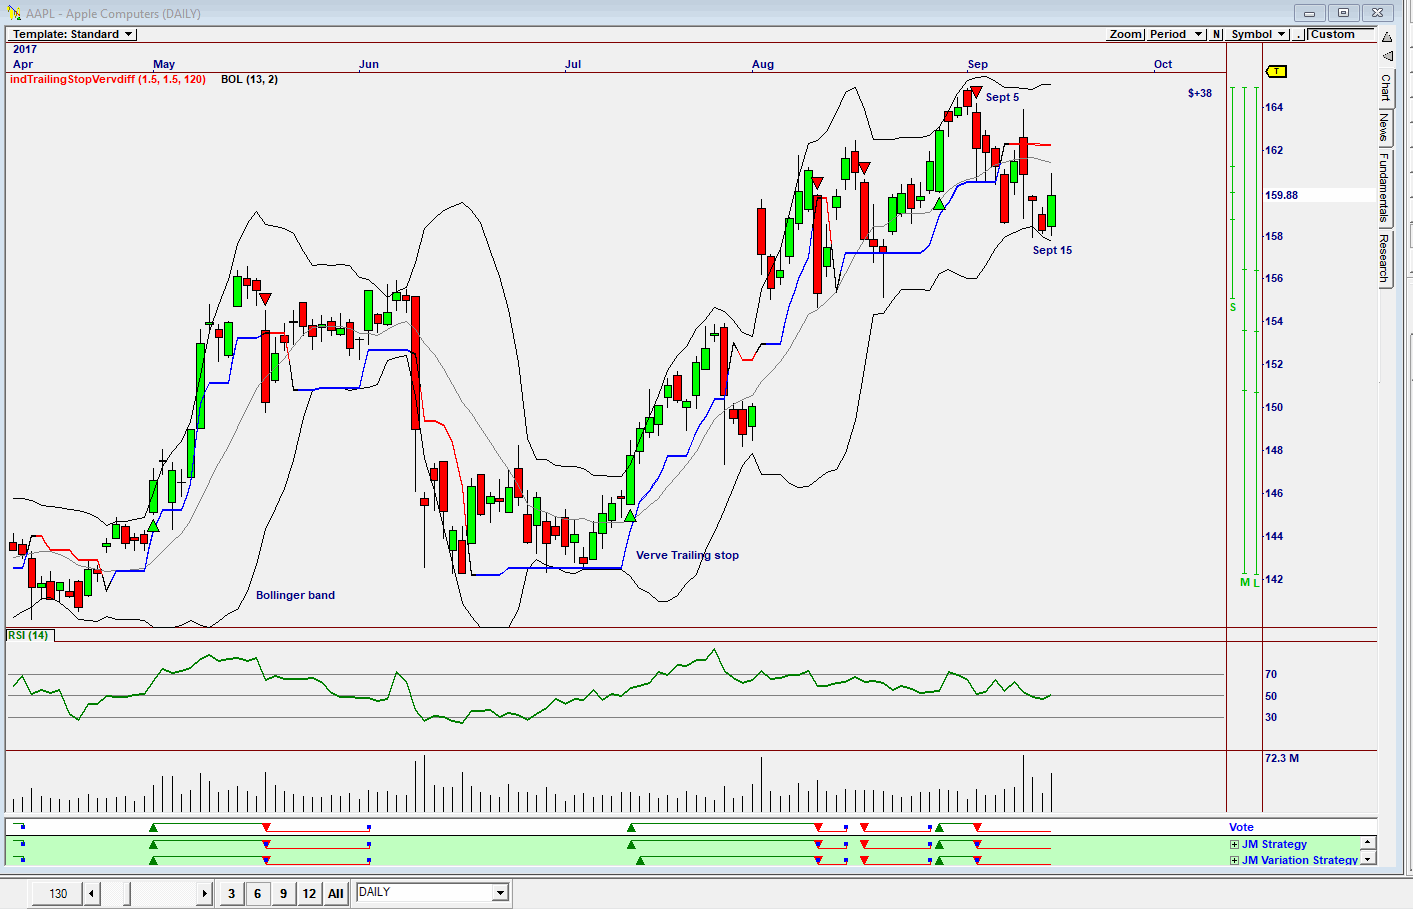
| Testing the strategy on Apple shares, a company that introduced new products during the month, one can see that a sell signal was given on September 5 when the share price fell from $164.25 to $160.56. Once again, looking at the chart, one can see that buy signals were not suggested at the low of the share price, but the buy signals given were all profitable. With the rise in the share price on Friday, September 15, after new Apple products were presented, one could be tempted to buy the share, but JM Strategy followers should wait for a buy signal. The JM Strategy as shown on the charts has proved very profitable over the months, and cautious conservative investors could use the strategy to generate profits. One is not buying at the bottom, or selling at the top, but the signals suggested have been successful. |
Has been a technical analyst since 1969, and has worked as a futures and options trader with First Financial Futures in Johannesburg, South Africa.
| Address: | 3256 West 24th Ave |
| Vancouver, BC | |
| Phone # for sales: | 6042634214 |
| E-mail address: | petroosp@gmail.com |
Click here for more information about our publications!
Comments
Date: 09/29/17Rank: 1Comment: The sell signal is defined by an undefined indicator Verve

|

Request Information From Our Sponsors
- VectorVest, Inc.
- Executive Premier Workshop
- One-Day Options Course
- OptionsPro
- Retirement Income Workshop
- Sure-Fire Trading Systems (VectorVest, Inc.)
- Trading as a Business Workshop
- VectorVest 7 EOD
- VectorVest 7 RealTime/IntraDay
- VectorVest AutoTester
- VectorVest Educational Services
- VectorVest OnLine
- VectorVest Options Analyzer
- VectorVest ProGraphics v6.0
- VectorVest ProTrader 7
- VectorVest RealTime Derby Tool
- VectorVest Simulator
- VectorVest Variator
- VectorVest Watchdog
- StockCharts.com, Inc.
- Candle Patterns
- Candlestick Charting Explained
- Intermarket Technical Analysis
- John Murphy on Chart Analysis
- John Murphy's Chart Pattern Recognition
- John Murphy's Market Message
- MurphyExplainsMarketAnalysis-Intermarket Analysis
- MurphyExplainsMarketAnalysis-Visual Analysis
- StockCharts.com
- Technical Analysis of the Financial Markets
- The Visual Investor
