

HOT TOPICS LIST
- MACD
- Fibonacci
- RSI
- Gann
- ADXR
- Stochastics
- Volume
- Triangles
- Futures
- Cycles
- Volatility
- ZIGZAG
- MESA
- Retracement
- Aroon
INDICATORS LIST
LIST OF TOPICS
PRINT THIS ARTICLE
by Mark Rivest
Stocks have bottomed at a bulls-eye target date, see when the next turn could come.
Position: N/A
Mark Rivest
Independent investment advisor, trader and writer. He has written articles for Technical Analysis of Stocks & Commodities, Traders.com Advantage,Futuresmag.com and, Finance Magnates. Author of website Four Dimension Trading.
PRINT THIS ARTICLE
FIBONACCI
Stock Bull Market Enters Twilight Zone
04/05/17 04:45:51 PMby Mark Rivest
Stocks have bottomed at a bulls-eye target date, see when the next turn could come.
Position: N/A
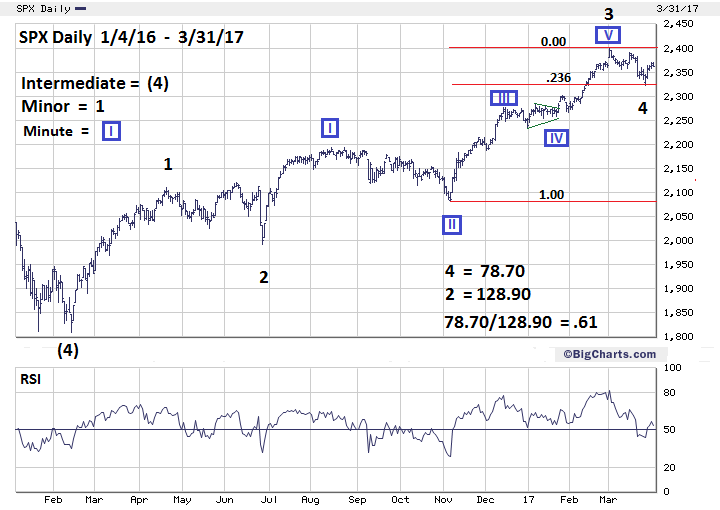
| After the S&P 500 (SPX) turned down from 2401 it appeared a correction had begun. My March 22nd article "Bond Yield Decision Point", noted Fibonacci time analysis pointing to March 27, 2017 as the bulls-eye target date for the end of the decline. Powerful evidence on March 27th indicates the decline may have ended at SPX 2322. If this bottom holds the SPX could be in the fifth and final wave up from the rally that began February 11, 2016. S&P 500 Daily There's a fascinating phenomenon about ninety minutes before sunrise. This is when first light appears transitioning from night into twilight. The night phase has maximum darkness and near total silence. Then, barely perceptible to humans, the darkness begins to fade. Birds, however, are acutely aware of the subtle change and begin singing, breaking the silence and heralding the approach of a new day. Something similar could be happening in the stock market. In every market, and for individual stocks, there's a point where the majority recognize the primary trend. For stock bull markets, this usually comes about 2/3 into the rise off a significant bottom. The SPX significant bottom was February 11, 2016. After the majority recognizes the bullish trend, they hope for a correction, usually about 5 to 10% to enter long positions. Sometimes the 5 to 10% decline never comes because there are so many players that recognize the primary bullish trend. Their steady buying prevents even a 5% decline. Since November 4th stocks have been on a relentless push higher, then in early March something very interesting happened. The financial media made note of the extended period in which the SPX has failed to decline even 1%. One analyst expressed the desire for a 1% decline just to bring some excitement back into the market. The headline of one article noted a prominent market analyst's call for a 5% correction. A call for a mere 5% decline is now headline news. These are signs of complacency in the stock market and indicates the rally is in the late stage. The media coverage about tiny declines could be the equivalent to birds signing at the first signs of twilight. Perhaps the stock market has entered a twilight zone just before the next bear market. Please see the daily SPX chart illustrated in Figure 1. My March 22nd article noted SPX support zone 2270-2300 and was based upon the decline from 2401 being about equal to the correction in June 2016. Also, a .382 retrace of the rally from November-March is at SPX 2279. This is what happened. The SPX June 2016 decline labeled wave "2" was 128.90 points and the supposed wave "4" decline from SPX 2401 was 78.70 points. 78.70/128.90 = .61, very close to the golden Fibonacci ratio of .618, and a common relation between waves "2" and "4". A .236 retracement of the rally from November 4th to March 1st is at 2326.10. The March 27th bottom was 2322.30. Turning in the proximity of two Fibonacci coordinates indicates a powerful support zone. Additionally, on March 24th the CBOE Put/Call ratio was 1.21; this is in the area that normally indicates at least a short- term bottom. This reading was made after only a 2.3% decline and the highest reading since the early November bottom. Evidence from three of the four market dimensions (Price, Time, and Sentiment) indicate a short-term bottom may have been made on March 27, 2017. |
|
| Figure 1. Evidence from three of the four market dimensions (Price, Time, and Sentiment) indicate a short-term bottom may have been made on March 27, 2017. |
| Graphic provided by: BigCharts.com. |
| |
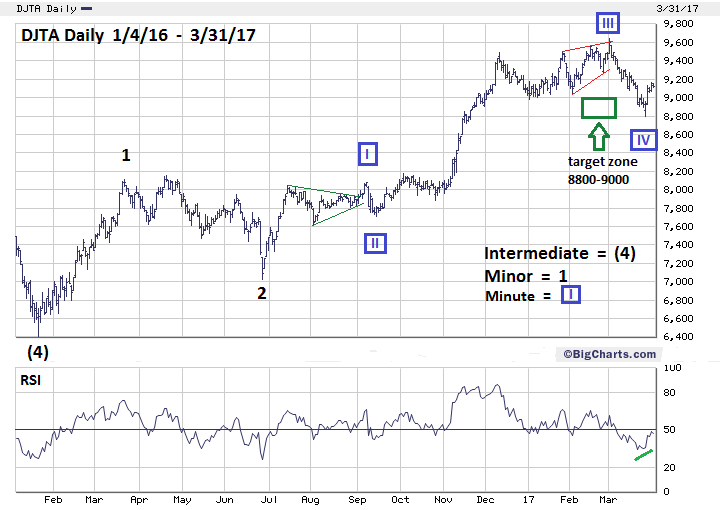
| Dow Jones Transportation Average (DJTA) Please see the DJTA daily chart illustrated in Figure 2. My March 22nd article noted the DJTA had support around 8800-9000, and on March 27th the DJTA had reached the lower end of the target zone bottoming at 8798.27. The daily RSI on March 21st reached a level near the June 2016 correction bottom and on the 27th had a bullish divergence. There is a high probability the DJTA has made a short-term correction bottom on March 27, 2017. The DJTA's incredibly clear Elliott wave count makes it the most important index to follow. |
|
| Figure 2. The DJTA�s incredibly clear Elliott wave count makes it the most important index to follow. |
| Graphic provided by: BigCharts.com. |
| |
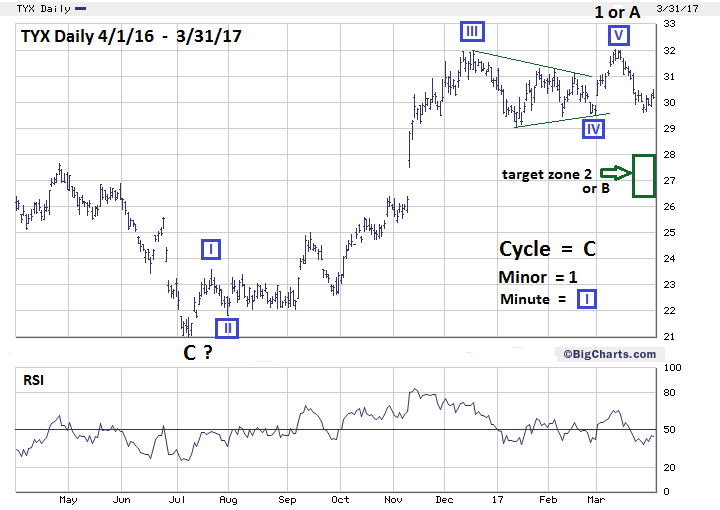
| US 30-Year Treasury Bond Yield Please see the Daily US 30-year Treasury Bond yield (TYX) chart illustrated in Figure 3. Since the FOMC meeting on March 15th the TYX has been in a decline. Normally yield charts have poor Elliott wave patterns. I suspect this is because yields are incapable of rising to infinity. Sometimes you can find a clear pattern; the TYX from the all-time low made in July 2016 is one of those times. There's a five-wave pattern from July 2016-March 2017. If the decline continues it could reach either a .382 retracement near 28, or fill the price gap between 26.4-27.50. If the TYX can reach this price zone or if it has already bottomed, there is a high probability that a rise above the double top at 32 could trigger a move to at least 38. A rise in 30-year yield would most likely be accompanied by a rise along the entire yield curve. If yields rise, the TYX may not exceed the 32 area until the second half of 2017. Investors that have 2-5 year bonds or CD's that are maturing within the next two months should wait until the 2nd half of 2017 to lock in possible higher 2-5 year rates. |
|
| Figure 3. Investors that have 2-5 year bonds or CD�s that are maturing within the next two months should wait until the 2nd half of 2017 to lock in possible higher 2-5 year rates. |
| Graphic provided by: BigCharts.com. |
| |
| Conclusion Elliott wave patterns are like Jigsaw puzzles, the more pieces you put together the easier it is to solve. The March 27th turn was calculated using the 47 trading days of Minor wave 2. Waves 1 and 5 usually have a Fibonacci time relationship. Minor wave 1 from the February 11, 2016 bottom was also 47 trading days. Using the ratios of .382, .618, and 1.00 calculates three possible termination dates for Minor wave 5; April 21st, May 8th, and June 2nd. Seasonality and longer term patterns favor May 8th as the bulls-eye target date. More about this scenario in a future article if necessary. My March 15th article "Discovering Fibonacci Price Targets" noted SPX 2445-2465 as a potential major peak. Stock bull markets climb a wall of worry. If the crowd is now anticipating declines instead of fearing them it means the stock market could be in a twilight zone just prior to the birth of a bear market. At some point the crowd will get a hoped for 5 - 10% decline in the stock market. There's an old saying — "Be careful what you wish for, you just might get it." Further Reading: Frost A.J and Robert Prechter (1985) "Elliott Wave Principle", New Classics Library. |
Independent investment advisor, trader and writer. He has written articles for Technical Analysis of Stocks & Commodities, Traders.com Advantage,Futuresmag.com and, Finance Magnates. Author of website Four Dimension Trading.
| Website: | www.fourdimensiontrading.com |
| E-mail address: | markrivest@gmail.com |
Click here for more information about our publications!
Comments

Request Information From Our Sponsors
- StockCharts.com, Inc.
- Candle Patterns
- Candlestick Charting Explained
- Intermarket Technical Analysis
- John Murphy on Chart Analysis
- John Murphy's Chart Pattern Recognition
- John Murphy's Market Message
- MurphyExplainsMarketAnalysis-Intermarket Analysis
- MurphyExplainsMarketAnalysis-Visual Analysis
- StockCharts.com
- Technical Analysis of the Financial Markets
- The Visual Investor
- VectorVest, Inc.
- Executive Premier Workshop
- One-Day Options Course
- OptionsPro
- Retirement Income Workshop
- Sure-Fire Trading Systems (VectorVest, Inc.)
- Trading as a Business Workshop
- VectorVest 7 EOD
- VectorVest 7 RealTime/IntraDay
- VectorVest AutoTester
- VectorVest Educational Services
- VectorVest OnLine
- VectorVest Options Analyzer
- VectorVest ProGraphics v6.0
- VectorVest ProTrader 7
- VectorVest RealTime Derby Tool
- VectorVest Simulator
- VectorVest Variator
- VectorVest Watchdog