HOT TOPICS LIST
- MACD
- Fibonacci
- RSI
- Gann
- ADXR
- Stochastics
- Volume
- Triangles
- Futures
- Cycles
- Volatility
- ZIGZAG
- MESA
- Retracement
- Aroon
INDICATORS LIST
LIST OF TOPICS
PRINT THIS ARTICLE
by David Penn
The CRB Index has been in a bull market for exactly one year. So what comes next for the subgroups?
Position: N/A
David Penn
Technical Writer for Technical Analysis of STOCKS & COMMODITIES magazine, Working-Money.com, and Traders.com Advantage.
PRINT THIS ARTICLE
REVERSAL
1-2-3 Reversals and Commodities
11/26/02 04:11:28 PMby David Penn
The CRB Index has been in a bull market for exactly one year. So what comes next for the subgroups?
Position: N/A
| I've written before about the 1-2-3 Trend Reversal popularized by "Trader" Vic Sperandeo in his book, Methods of a Wall Street Master. In addition to being an excellent trading tool, the 1-2-3 Trend Reversal methodology is a good way of looking at indexes and subindexes -- particularly after they have made a strong and/or lasting move. One of the more essential truisms of technical analysis is the saying: "the trend is your friend until the end when it bends." Spotting the "bend" is exactly what the 1-2-3 Trend Reversal is all about. |
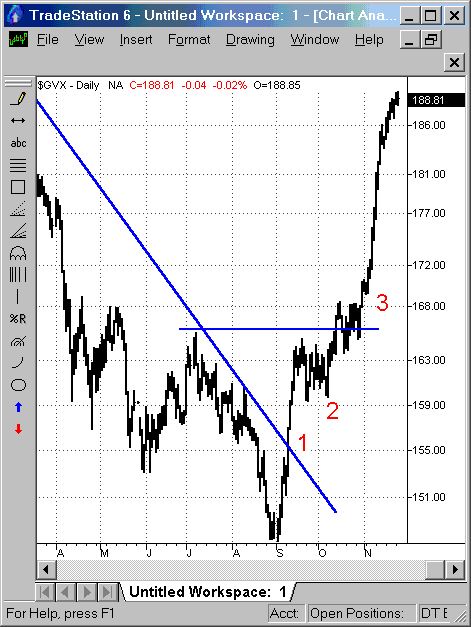
| Consider first the Goldman Sachs Livestock subgroup index ($GVX). This index peaked at 194.75 the end of January 2002 and has been falling ever since, finally reaching a bottom in late August of this year at 147.40. Note how the index rallies into September, breaking the downtrend line from the January 2002 peak. The move up from the August bottom was already a powerful one when the downtrend line was broken. But was it simply a bear market rally? Or did the up move anticipate a true reversal in trend? |

|
| This trend reversal met all three conditions of the 1-2-3 Trend Reversal methodology. The upside after condition "3" was quite significant. |
| Graphic provided by: TradeStation. |
| |
| The 1-2-3 Trend Reversal method notes that after breaking the downtrend line at "1", the index made an attempt to resume the previous downtrend in late September. This attempt is the "2" of the 1-2-3 Trend Reversal methodology. If prices fail to resume the course of the prevailing trend (downward, in this case), then there is a strong chance that the trend is in fact reversing. One thing to look for in such a situation is a strong price move that counters the attempt to resume the previous trend. In the case of the Goldman Sachs Livestock subgroup index, just such a strong price move begins in the middle of October and continues with some force toward the end of the month. Additional confirmation is provided by the break above resistance at 165.5 and 168. The movement above this point is the "3" in the 1-2-3 Trend Reversal method, the final confirmation that the trend has reversed. |
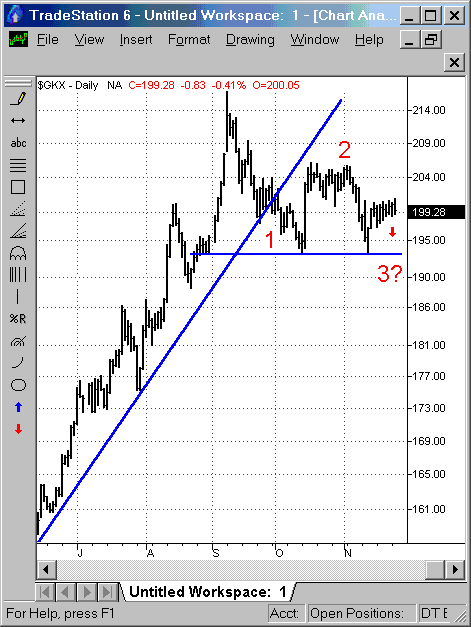
| Compare this to an uptrend which looks vulnerable to reversal even though the reversal has not yet occurred. The Goldman Sachs Agricultural subgroup index ($GKX) has been in an uptrend since May 2002, when it bottomed out at 149. By the beginning of September, this index had climbed 67.88 to 216.88 -- an advance of more than 45%. This is quite a sizeable move, and in a relatively short period of time as well (about five months). This index faltered in September, and crashed through its uptrend line in mid-month. This down move represented the "1" in a potential 1-2-3 Trend Reversal. The rally in early October represented an attempt to resume the prevailing uptrend; its failure near the end of October would be considered the "2" in the 1-2-3 Trend Reversal methodology. Because the index has yet to break down beneath support at about 193, the "3" part of the trend, the final confirmation of the trend reversal, has yet to take place. But given the index's price action from trend line break ("1") to failed attempt at new highs ("2"), those who are long agriculturals (mostly grains like wheat, corn and the soybean complex), may want to consider taking profits. |
 A trend line break and a failed attempt to make new highs suggests this uptrend in the Goldman Sachs Agricultural subgroup index may be over. It is worth noting that Sperandeo encourages those who trade the 1-2-3 Trend Reversal to consider making their trade right after condition "2", as opposed to waiting for the full confirmation of condition "3". His reasons are numerous, but taking a position after condition "2" does greatly increase the risk/reward ratio in the trader's favor. Take the Goldman Sachs Agricultural subgroup index for example and assume that this index itself was tradable. Let us also use the swing rule (see my "Livestock's Last Upswing", Traders.com Advantage, November 21, 2002 for a refresher on this concept articulated by Stan Weinstein in Secrets for Profiting in Bull and Bear Markets) to suggest a potential downside target of about 169. If a trader sold the $GKX right after condition "2" was met, say on November 12th after two significant down days, then the entry price would be about 198. A stop at the top of the October consolidation (around 206) would allow for eight points of risk compared to a potential 29 point gain -- a risk/reward ratio of better than 1 to 3.5. If, however, the trader waited until condition "3" was met, gaining a likely fill around 192, the risk/reward ratio drops to about 1 to 2 3/4. And this assumes the same eight points of risk. If the buy stop were kept at the same 206 level, then the risk/reward ratio would drop even farther, to 1 to 1 3/4. |
Technical Writer for Technical Analysis of STOCKS & COMMODITIES magazine, Working-Money.com, and Traders.com Advantage.
| Title: | Technical Writer |
| Company: | Technical Analysis, Inc. |
| Address: | 4757 California Avenue SW |
| Seattle, WA 98116 | |
| Phone # for sales: | 206 938 0570 |
| Fax: | 206 938 1307 |
| Website: | www.Traders.com |
| E-mail address: | DPenn@traders.com |
Traders' Resource Links | |
| Charting the Stock Market: The Wyckoff Method -- Books | |
| Working-Money.com -- Online Trading Services | |
| Traders.com Advantage -- Online Trading Services | |
| Technical Analysis of Stocks & Commodities -- Publications and Newsletters | |
| Working Money, at Working-Money.com -- Publications and Newsletters | |
| Traders.com Advantage -- Publications and Newsletters | |
| Professional Traders Starter Kit -- Software | |
Click here for more information about our publications!
Comments
Date: 01/16/03Rank: 5Comment:

|

Request Information From Our Sponsors
- StockCharts.com, Inc.
- Candle Patterns
- Candlestick Charting Explained
- Intermarket Technical Analysis
- John Murphy on Chart Analysis
- John Murphy's Chart Pattern Recognition
- John Murphy's Market Message
- MurphyExplainsMarketAnalysis-Intermarket Analysis
- MurphyExplainsMarketAnalysis-Visual Analysis
- StockCharts.com
- Technical Analysis of the Financial Markets
- The Visual Investor
- VectorVest, Inc.
- Executive Premier Workshop
- One-Day Options Course
- OptionsPro
- Retirement Income Workshop
- Sure-Fire Trading Systems (VectorVest, Inc.)
- Trading as a Business Workshop
- VectorVest 7 EOD
- VectorVest 7 RealTime/IntraDay
- VectorVest AutoTester
- VectorVest Educational Services
- VectorVest OnLine
- VectorVest Options Analyzer
- VectorVest ProGraphics v6.0
- VectorVest ProTrader 7
- VectorVest RealTime Derby Tool
- VectorVest Simulator
- VectorVest Variator
- VectorVest Watchdog
