HOT TOPICS LIST
- MACD
- Fibonacci
- RSI
- Gann
- ADXR
- Stochastics
- Volume
- Triangles
- Futures
- Cycles
- Volatility
- ZIGZAG
- MESA
- Retracement
- Aroon
INDICATORS LIST
LIST OF TOPICS
PRINT THIS ARTICLE
by David Penn
As the Goldman Sachs Livestock subgroup goes parabolic, it looks like the bull markets in cattle and pork bellies are on their last legs.
Position: N/A
David Penn
Technical Writer for Technical Analysis of STOCKS & COMMODITIES magazine, Working-Money.com, and Traders.com Advantage.
PRINT THIS ARTICLE
SWING CHART
Livestock's Last Upswing
11/21/02 09:51:20 AMby David Penn
As the Goldman Sachs Livestock subgroup goes parabolic, it looks like the bull markets in cattle and pork bellies are on their last legs.
Position: N/A
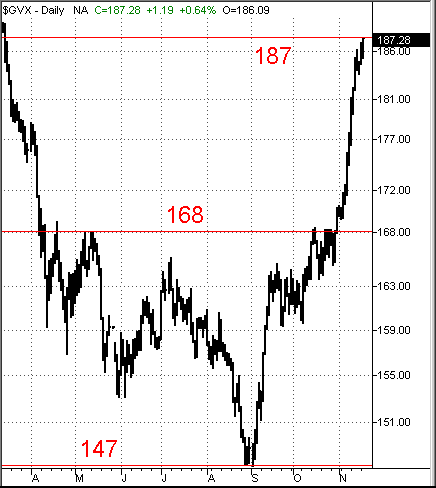
| At this point in time, any price chart that resembles the Nasdaq's Icarus-like move toward 5,000 should bring out near unanimous concern. But just such a vertical leap has been taking place in the Goldman Sachs Livestock commodity subgroup, suggesting that the strong bull markets livestock futures have enjoyed since the summer of 2002 may be getting dangerously overextended. A look at the commodity group subindex, $GVX, shows that the case for overextension almost makes itself. Bottoming in late August, the $GVX exploded in September, rising over 10% by month's end. The Livestock group consolidated for most of October, before rocketing up again in early November, tacking on an additional 12% in the first two weeks of the month. |
| This index reflects a group (or subgroup) that has moved a great deal in a relatively short period of time. Even given the six-odd week consolidation from mid-September to the end of October, the rally in livestock commodities is exceptional. So exceptional, in fact, that traders and market analysts should begin to consider whether or not livestock's most bullish days are behind it, as opposed to in front. |

|
| The swing rule suggests that the advance in the Goldman Sachs Livestock subgroup is on its last legs. |
| Graphic provided by: TradeStation. |
| |
| One of the reasons for this caution comes from what Stan Weinstein in "Secrets of Profiting in Bull and Bear Markets" calls the "swing rule." The notion behind the swing rule is something that every chart reader and pattern recognition trader or analyst uses to one degree or another. For example, when determining measurement rules for a variety of chart patterns such as head and shoulders, double bottoms and tops, and cup with handles, a version of the swing rule is almost always employed. |
| How does the swing rule work? It operates on the notion that the rally following a major decline will likely be proportionate to the size of the decline. Here, we see that the livestock subgroup broke down at about 168--a point that served as resistance to as least two rallies before the subgroup finally collapsed. The trough low following this decline was 147. To employ the swing rule, add the difference between the breakdown point and the trough low (approximately 21 points) to the value at the breakdown point, which yields a total of 189. This is the area where we should expect the livestock subgroup to run into trouble--either by way of resistance or, in the more serious case, outright reversal. |
| Given the $GVX's most recent close just north of 187, it appears that--per the swing rule--the livestock subgroup has topped, at least for now. While each of the components has its own characteristics (which I will address in a follow-up article), it is worth noting that commodity futures such as cattle, hogs and pork bellies likely will see increasing difficulty in making and/or sustaining new highs going forward. |
Technical Writer for Technical Analysis of STOCKS & COMMODITIES magazine, Working-Money.com, and Traders.com Advantage.
| Title: | Technical Writer |
| Company: | Technical Analysis, Inc. |
| Address: | 4757 California Avenue SW |
| Seattle, WA 98116 | |
| Phone # for sales: | 206 938 0570 |
| Fax: | 206 938 1307 |
| Website: | www.Traders.com |
| E-mail address: | DPenn@traders.com |
Traders' Resource Links | |
| Charting the Stock Market: The Wyckoff Method -- Books | |
| Working-Money.com -- Online Trading Services | |
| Traders.com Advantage -- Online Trading Services | |
| Technical Analysis of Stocks & Commodities -- Publications and Newsletters | |
| Working Money, at Working-Money.com -- Publications and Newsletters | |
| Traders.com Advantage -- Publications and Newsletters | |
| Professional Traders Starter Kit -- Software | |
Click here for more information about our publications!
Comments
Date: 11/26/02Rank: 4Comment:

Request Information From Our Sponsors
- VectorVest, Inc.
- Executive Premier Workshop
- One-Day Options Course
- OptionsPro
- Retirement Income Workshop
- Sure-Fire Trading Systems (VectorVest, Inc.)
- Trading as a Business Workshop
- VectorVest 7 EOD
- VectorVest 7 RealTime/IntraDay
- VectorVest AutoTester
- VectorVest Educational Services
- VectorVest OnLine
- VectorVest Options Analyzer
- VectorVest ProGraphics v6.0
- VectorVest ProTrader 7
- VectorVest RealTime Derby Tool
- VectorVest Simulator
- VectorVest Variator
- VectorVest Watchdog
- StockCharts.com, Inc.
- Candle Patterns
- Candlestick Charting Explained
- Intermarket Technical Analysis
- John Murphy on Chart Analysis
- John Murphy's Chart Pattern Recognition
- John Murphy's Market Message
- MurphyExplainsMarketAnalysis-Intermarket Analysis
- MurphyExplainsMarketAnalysis-Visual Analysis
- StockCharts.com
- Technical Analysis of the Financial Markets
- The Visual Investor
