

HOT TOPICS LIST
- MACD
- Fibonacci
- RSI
- Gann
- ADXR
- Stochastics
- Volume
- Triangles
- Futures
- Cycles
- Volatility
- ZIGZAG
- MESA
- Retracement
- Aroon
INDICATORS LIST
LIST OF TOPICS
PRINT THIS ARTICLE
by Koos van der Merwe
With the Wells Fargo fraud hitting the news, we now know the reason for the weakness forecasted in my June 6th article.
Position: Sell
Koos van der Merwe
Has been a technical analyst since 1969, and has worked as a futures and options trader with First Financial Futures in Johannesburg, South Africa.
PRINT THIS ARTICLE
RETRACEMENT
Wells Fargo Revised
09/28/16 04:25:36 PMby Koos van der Merwe
With the Wells Fargo fraud hitting the news, we now know the reason for the weakness forecasted in my June 6th article.
Position: Sell
| The news this past week was full of the way Wells Fargo employees created millions of fake accounts for the bank's customers, in an effort to meet unreasonable internal sales targets and boost low-level employees' compensation. At a hearing before the Senate Banking Committee earlier last week, Wells Fargo CEO John Stumpf exposed the magnitude of the bank's corporate governance failures. Stumpf testified that the fraud was first discovered in 2011 when the bank fired more than 1,000 employees for opening fake accounts. Since then more than 4,000 additional employees have been fired, but not one senior executive has been terminated. CEO John Stumpf revealed in his testimony that the most trustworthy of the too-big-to-fail institutions, is not trustworthy at all. So, with this scandal hitting the headlines, is Wells Fargo a buy? With management keeping their enormous salaries, the only parties being punished are the shareholders. So, do you buy the shares on present weakness, or wait for the mess to be cleaned up first, should that ever happen? Will a bank bubble pop like one did in 2007? |
|
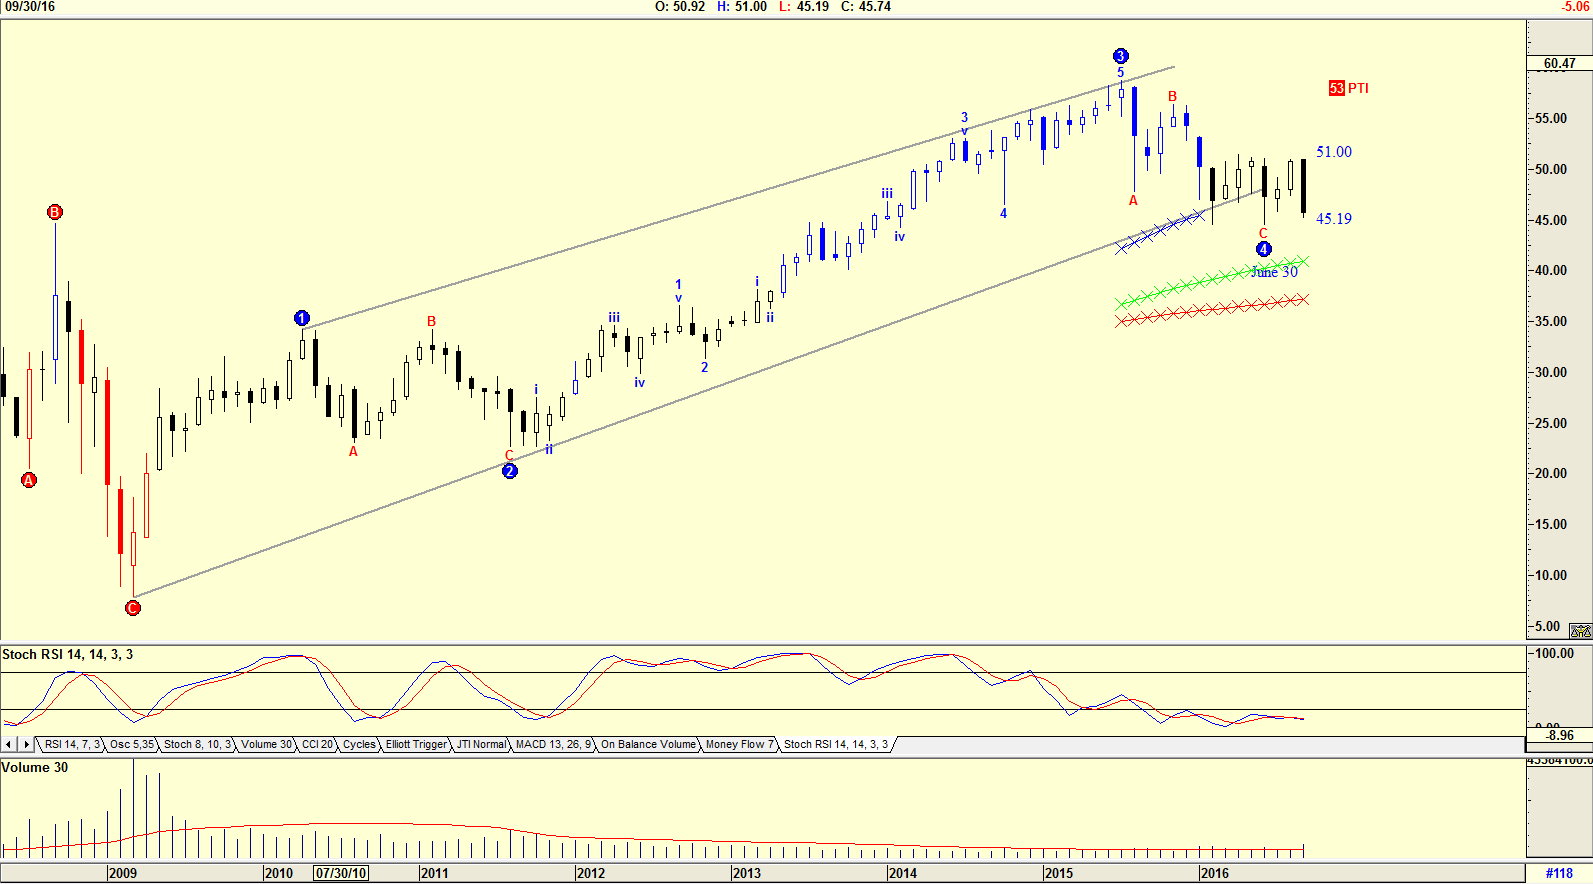
| Figure 1. Monthly chart with Elliott wave count. |
| Graphic provided by: AdvancedGET. |
| |
| The chart in Figure 1 is a monthly chart of Wells Fargo with an Elliott wave count suggesting that the share price may have completed a WAVE 4 bottom on June 30th with the RSI indicator at overbought levels, but not giving a buy signal. However, this was before the scandal hit the headlines. The chart shows how the share price fell strongly over the past month, from a high of $51.00 to a low of $45.19. Volume rose above average with the fall, and with the RSI moving sideways, the chart suggests a further fall in the months ahead. |
|
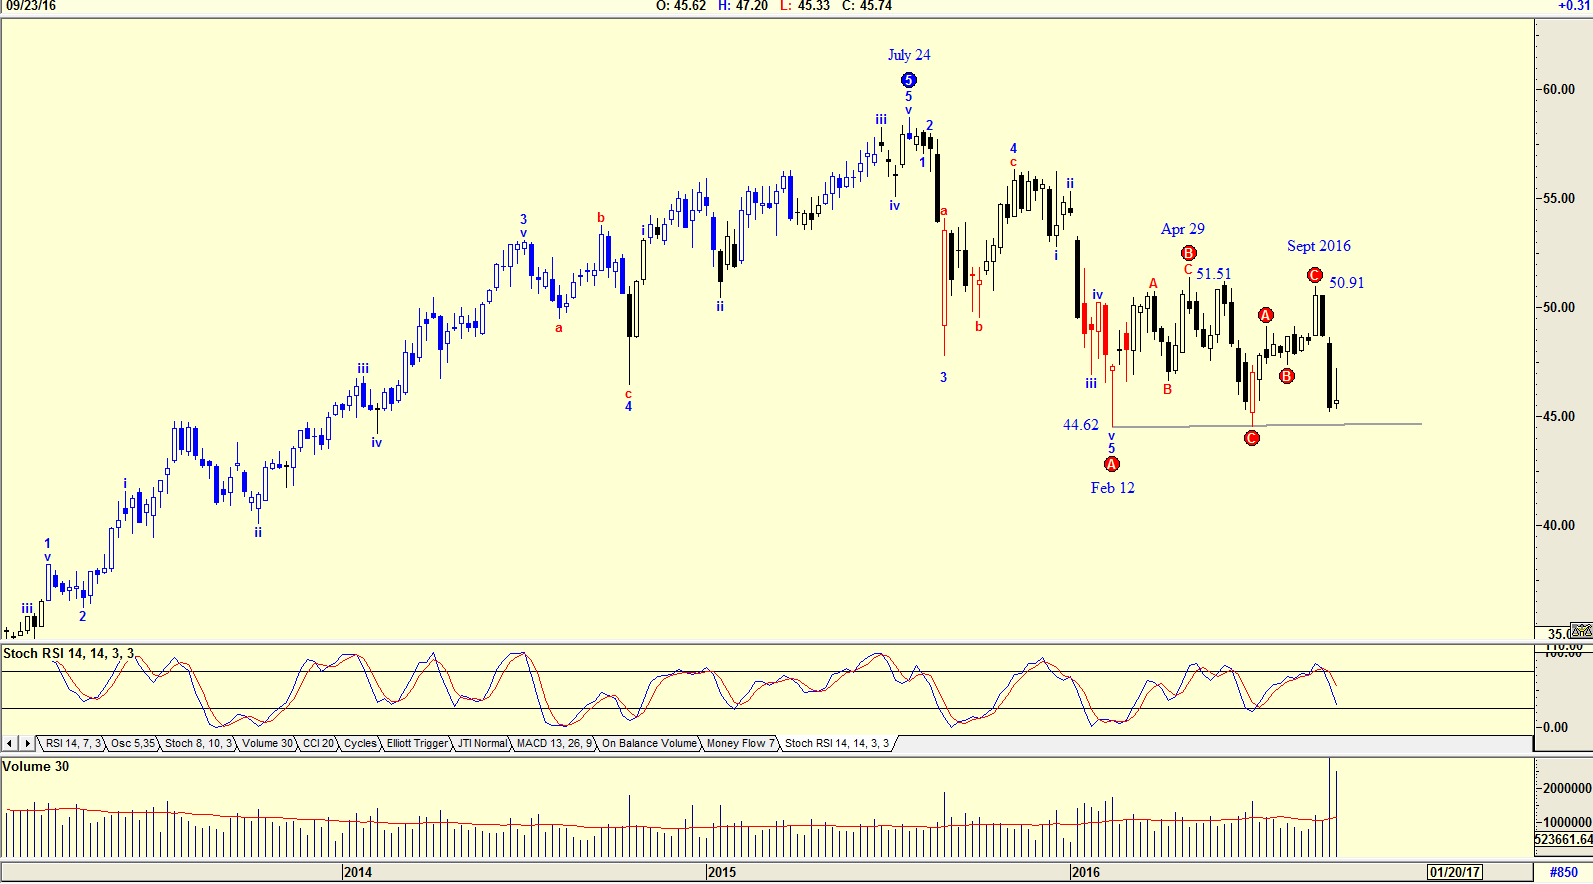
| Figure 2. Weekly chart showing an Elliott B-Wave failure. |
| Graphic provided by: AdvancedGET. |
| |
| The chart in Figure 2 is a weekly chart showing how the share price reached an Elliott Wave 5 on July 24th 2015 and then fell in a WAVE A to $44.62 by February 12th 2016. The Stochastic RSI indicator suggested strength but the share rose weakly in a WAVE B to $51.51 by April 29th and promptly fell to retest support at $44.62. The share price then rose again to %50.91 by Sept 2016 but fell as news of the company's mismanagement hit the headlines. The Stochastic RSI is suggesting that the share price will retest the $44.62 support line. The high volume shown as the share price fell suggests that it could break through the support line to lower levels. |
|
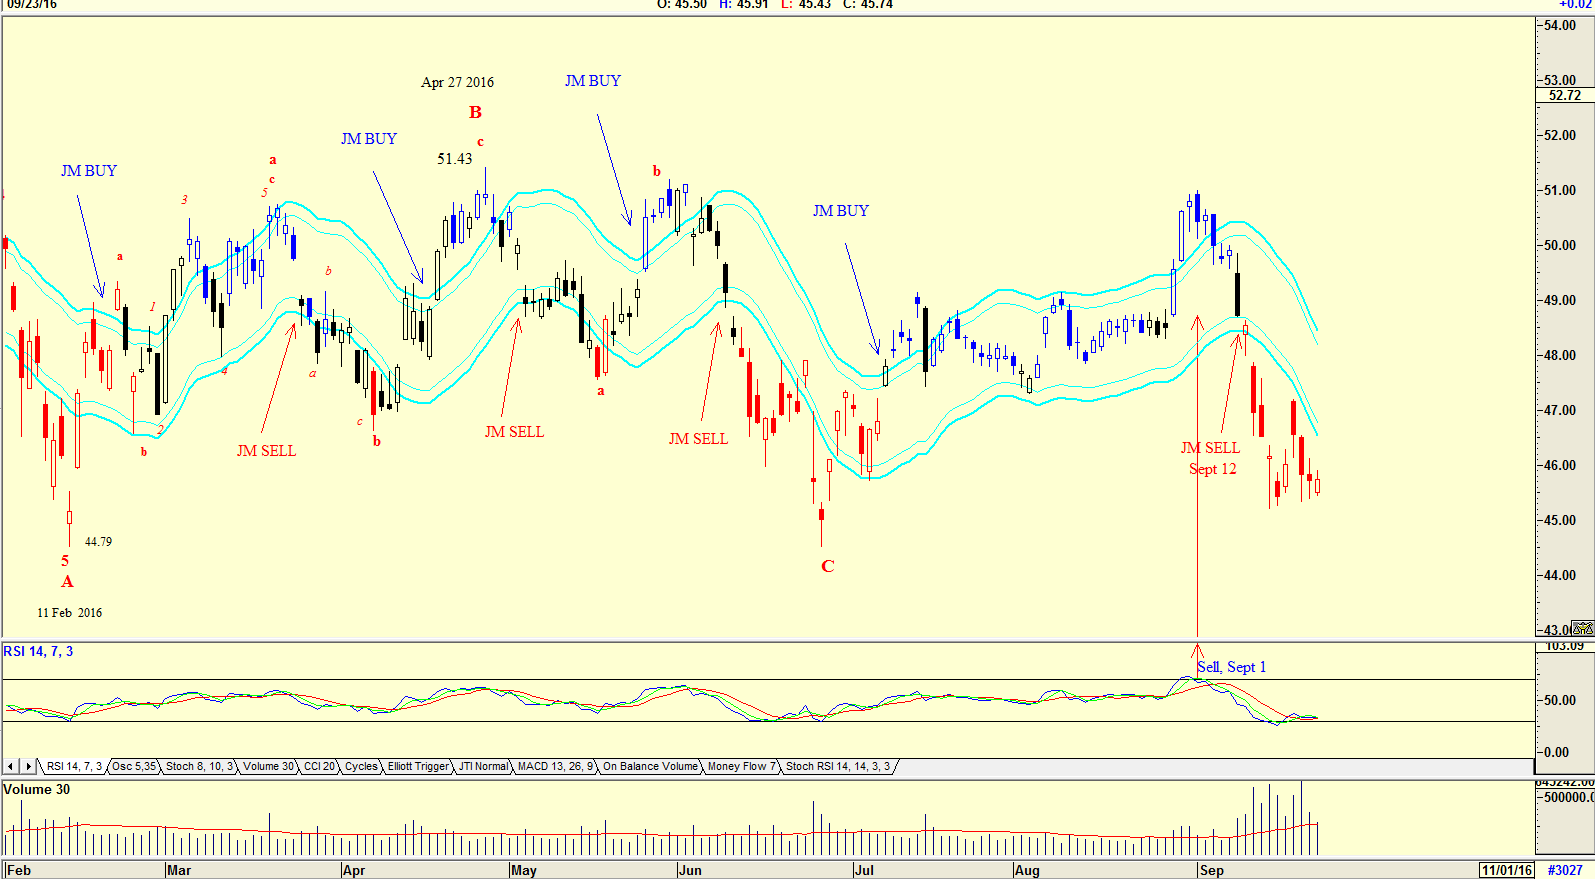
| Figure 3. Daily chart showing collapse of the share price. |
| Graphic provided by: AdvancedGET. |
| |
| The chart in Figure 3 is a daily chart with a JM Internal Band showing a sell signal given on September 12th. The RSI indicator on the other hand, suggested a sell on September 1st, at least two weeks before the Senate Banking Committee hearing, suggesting possible sales of the share by those in the know. Volume, however, was below average, and only started increasing as the share price fell. The RSI indicator has recently suggested a buy and the share price did rise strongly, but it fell again as the Senate hearing was broadcast. In my June 6th article, I concluded that in spite of an attractive dividend, Wells Fargo is a share that should be watched and bought-and-held once the indicators suggest a buy. With the present scandal, the share price could fall further as management, with the possible resignation of the CEO John Stumpf in the wings, assesses itself. The company is a sound company. Management has unfortunately been lacking because the bank is too large, as hinted at the hearing. The share should be placed on a watch list waiting to see what the outcome will be. |
Has been a technical analyst since 1969, and has worked as a futures and options trader with First Financial Futures in Johannesburg, South Africa.
| Address: | 3256 West 24th Ave |
| Vancouver, BC | |
| Phone # for sales: | 6042634214 |
| E-mail address: | petroosp@gmail.com |
Click here for more information about our publications!
PRINT THIS ARTICLE

Request Information From Our Sponsors
- StockCharts.com, Inc.
- Candle Patterns
- Candlestick Charting Explained
- Intermarket Technical Analysis
- John Murphy on Chart Analysis
- John Murphy's Chart Pattern Recognition
- John Murphy's Market Message
- MurphyExplainsMarketAnalysis-Intermarket Analysis
- MurphyExplainsMarketAnalysis-Visual Analysis
- StockCharts.com
- Technical Analysis of the Financial Markets
- The Visual Investor
- VectorVest, Inc.
- Executive Premier Workshop
- One-Day Options Course
- OptionsPro
- Retirement Income Workshop
- Sure-Fire Trading Systems (VectorVest, Inc.)
- Trading as a Business Workshop
- VectorVest 7 EOD
- VectorVest 7 RealTime/IntraDay
- VectorVest AutoTester
- VectorVest Educational Services
- VectorVest OnLine
- VectorVest Options Analyzer
- VectorVest ProGraphics v6.0
- VectorVest ProTrader 7
- VectorVest RealTime Derby Tool
- VectorVest Simulator
- VectorVest Variator
- VectorVest Watchdog