HOT TOPICS LIST
- MACD
- Fibonacci
- RSI
- Gann
- ADXR
- Stochastics
- Volume
- Triangles
- Futures
- Cycles
- Volatility
- ZIGZAG
- MESA
- Retracement
- Aroon
INDICATORS LIST
LIST OF TOPICS
PRINT THIS ARTICLE
by Koos van der Merwe
With so many analysts calling for a decline in the stock market, looking for safe investments has become a must. Wells Fargo could be a share to buy and hold.
Position: Sell
Koos van der Merwe
Has been a technical analyst since 1969, and has worked as a futures and options trader with First Financial Futures in Johannesburg, South Africa.
PRINT THIS ARTICLE
TECHNICAL ANALYSIS
A Look At Wells Fargo
06/06/16 04:45:21 PMby Koos van der Merwe
With so many analysts calling for a decline in the stock market, looking for safe investments has become a must. Wells Fargo could be a share to buy and hold.
Position: Sell
| Wells Fargo & Company is an American multinational banking and financial services company. What makes them attractive is that they have survived the mortgage meltdown, and although they cut their payable dividend from $0.34 per quarter to $0.05 on April 2nd 2009, over the years they have gradually increased it and on April 26th, 2016 they declared a dividend of $0.38 payable on June 1st, 2016 to shareholders of record on May 6th, 2016. |

|
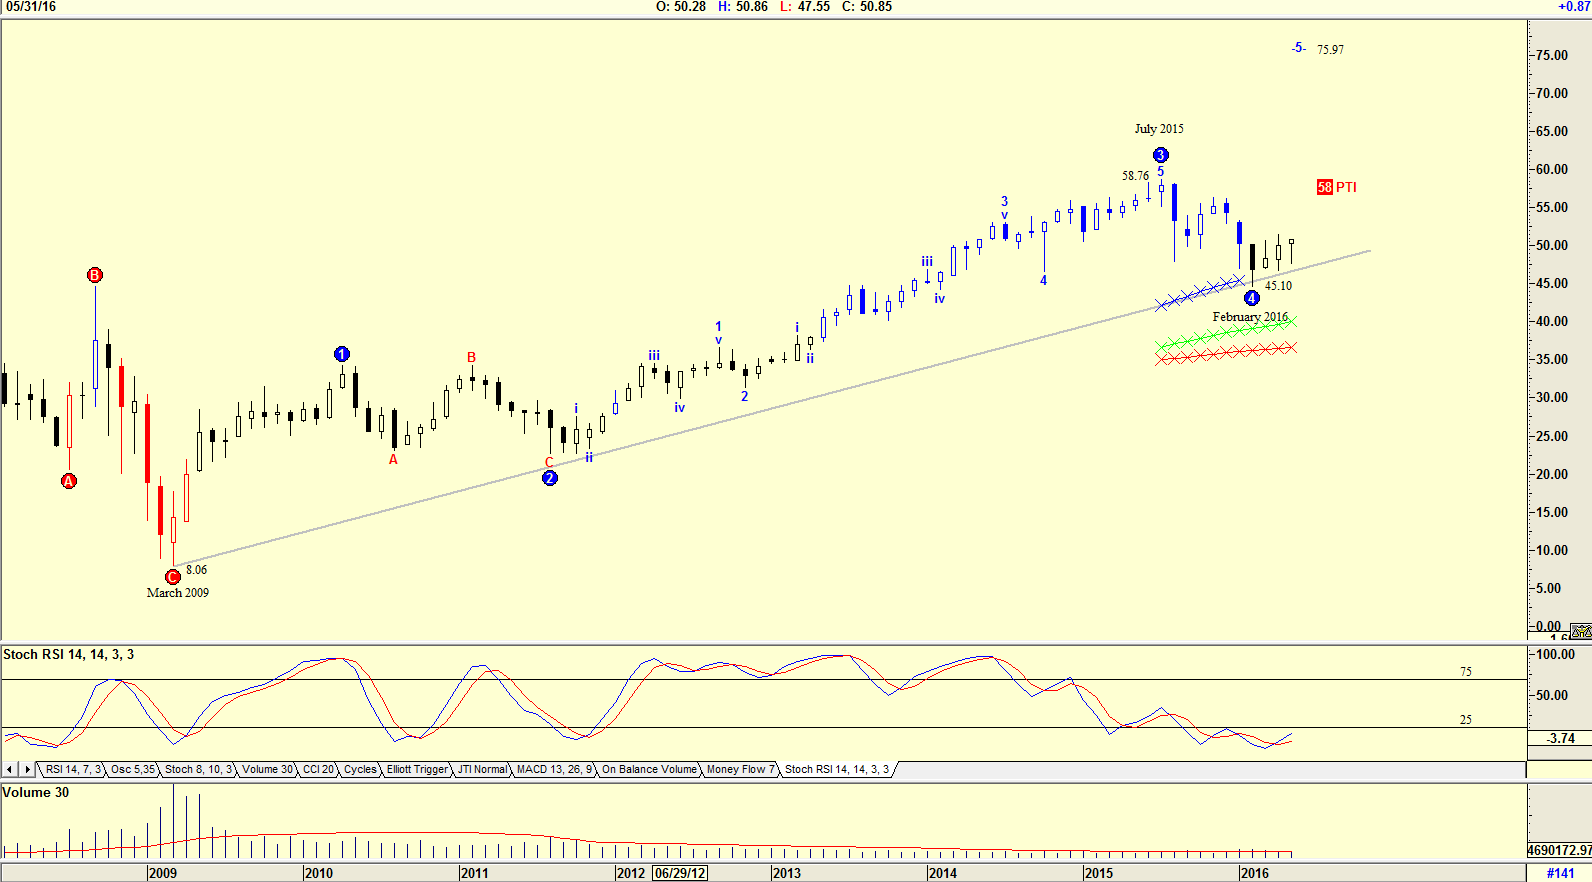
| Figure 1. Monthly chart of WFC with an Elliott wave count. |
| Graphic provided by: AdvancedGET. |
| |
| The chart in Figure 1 is a monthly chart of Wells Fargo showing how the share price bottomed in March 2009 at $8.06. From that level the share price slowly improved to $58.76 by July 2015 in an Elliott WAVE 3. From that high it has fallen in a WAVE 4 to $45.10 by February 2016. The share price has slowly recovered and could now be in a WAVE 5, with a target of $75.97. The PTI (Probability Index) is 58, suggesting that there is a 58% chance that the share price will reach this target. Do note that share price has bounced off of the long term support line. Also note that the Stochastic RSI is at oversold levels, and although the indicator has suggested a buy because it crossed the 3 period moving average, it has not confirmed a buy signal by rising above the 25 period horizontal line. Volume shown is also below average. |

|
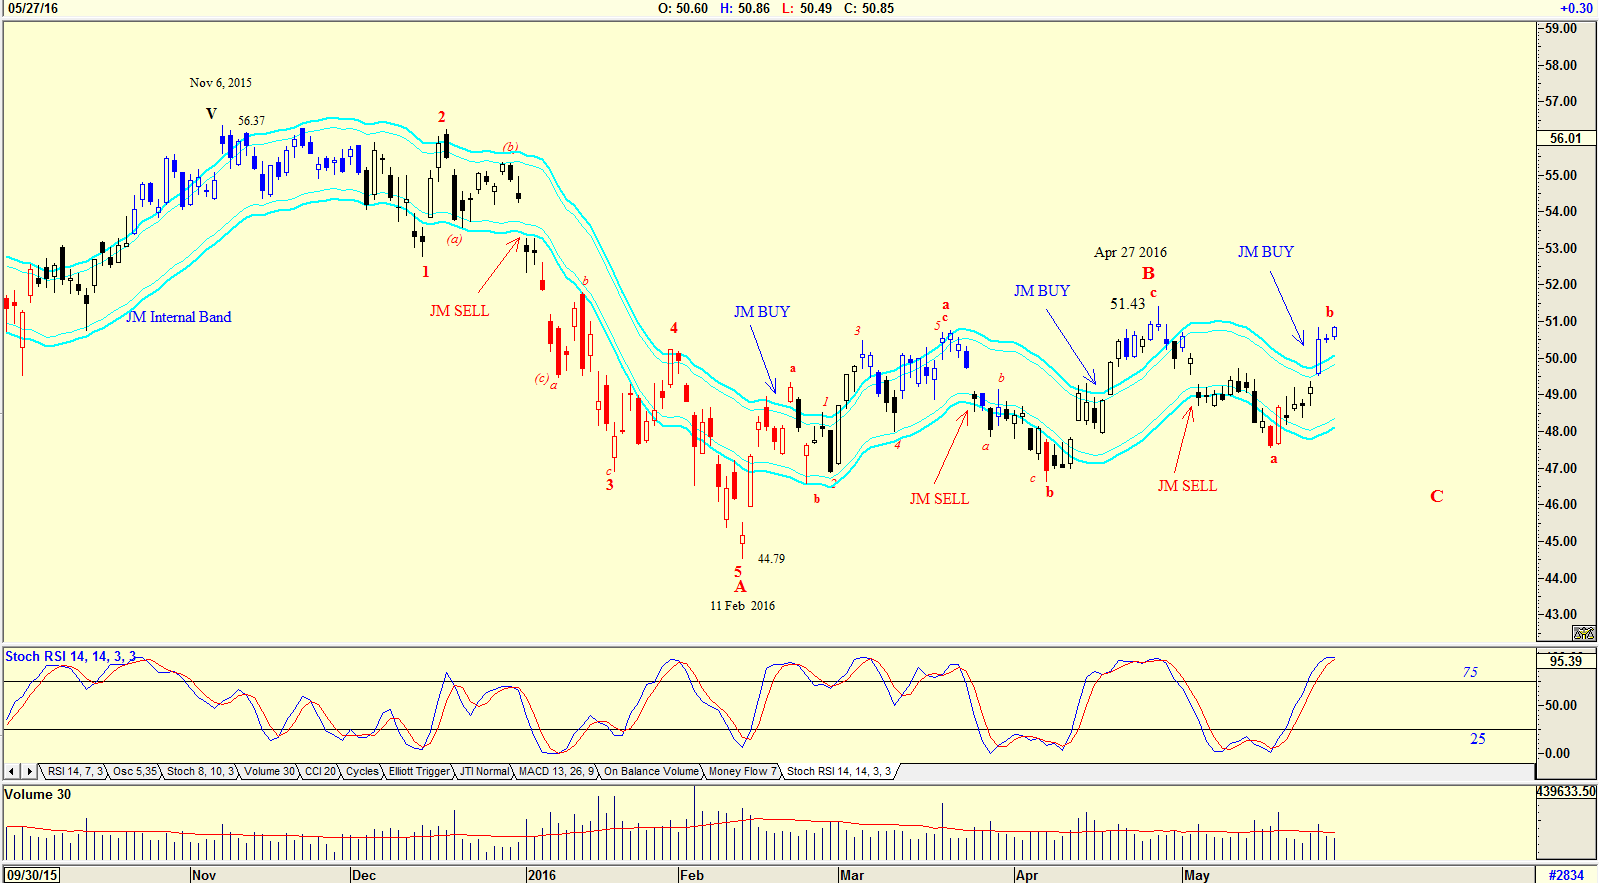
| Figure 2. WFC daily chart suggesting a correction down. |
| Graphic provided by: AdvancedGET. |
| |
| The daily chart in Figure 2 is a daily chart showing how the share price has fallen from a high of $56.37 on November 6th, 2015 to a low of $44.79 by February 11th, 2016. The share price rose to $51.43 by April 27th, 2016 but has since fallen in what could be an abc correction of a WAVE C. This appears to be confirmed by the Stochastic RSI indicator which is at overbought levels, but has not yet given a sell signal by falling below the 75 horizontal line. It has also not broken below the moving average but is close to doing so. When it does that it will suggest weakness ahead. Do note that as the share price rose recently, volume fell below average suggesting weakness. Finally, look at the JM Internal Band indicator. The JM Internal Band is a 15 period simple moving average offset by 2% positive and 2% negative. A move above the upper band suggests a buy and below the lower band a sell. At the moment the share price is in a JM internal band buy position. A move below the lower band will suggest a JM Internal Band sell. The charts of Wells Fargo are suggesting weakness ahead, and this in spite of an attractive dividend. Wells Fargo is a share that should be watched, and bought and held for the long term once the indicators of the chart suggest a buy. |
Has been a technical analyst since 1969, and has worked as a futures and options trader with First Financial Futures in Johannesburg, South Africa.
| Address: | 3256 West 24th Ave |
| Vancouver, BC | |
| Phone # for sales: | 6042634214 |
| E-mail address: | petroosp@gmail.com |
Click here for more information about our publications!
PRINT THIS ARTICLE

Request Information From Our Sponsors
- StockCharts.com, Inc.
- Candle Patterns
- Candlestick Charting Explained
- Intermarket Technical Analysis
- John Murphy on Chart Analysis
- John Murphy's Chart Pattern Recognition
- John Murphy's Market Message
- MurphyExplainsMarketAnalysis-Intermarket Analysis
- MurphyExplainsMarketAnalysis-Visual Analysis
- StockCharts.com
- Technical Analysis of the Financial Markets
- The Visual Investor
- VectorVest, Inc.
- Executive Premier Workshop
- One-Day Options Course
- OptionsPro
- Retirement Income Workshop
- Sure-Fire Trading Systems (VectorVest, Inc.)
- Trading as a Business Workshop
- VectorVest 7 EOD
- VectorVest 7 RealTime/IntraDay
- VectorVest AutoTester
- VectorVest Educational Services
- VectorVest OnLine
- VectorVest Options Analyzer
- VectorVest ProGraphics v6.0
- VectorVest ProTrader 7
- VectorVest RealTime Derby Tool
- VectorVest Simulator
- VectorVest Variator
- VectorVest Watchdog
