

HOT TOPICS LIST
- MACD
- Fibonacci
- RSI
- Gann
- ADXR
- Stochastics
- Volume
- Triangles
- Futures
- Cycles
- Volatility
- ZIGZAG
- MESA
- Retracement
- Aroon
INDICATORS LIST
LIST OF TOPICS
PRINT THIS ARTICLE
by Mark Rivest
Could the bottom made in 2008 be breached in 2016?
Position: N/A
Mark Rivest
Independent investment advisor, trader and writer. He has written articles for Technical Analysis of Stocks & Commodities, Traders.com Advantage,Futuresmag.com and, Finance Magnates. Author of website Four Dimension Trading.
PRINT THIS ARTICLE
MARKET TIMING
Nikkei 225 Colossal Bear Market
05/08/15 01:54:24 PMby Mark Rivest
Could the bottom made in 2008 be breached in 2016?
Position: N/A
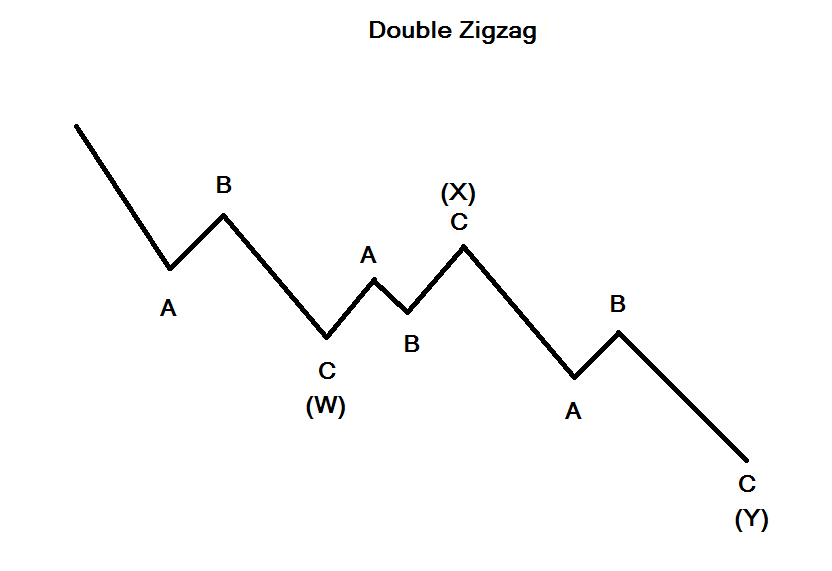
| On December 29,1989 Japan's Nikkei 225 stock index recorded an all time high at 38,957. The downward journey from that height, lasted 18 years, reaching a nadir at 6,994. The loss from the peak — a stunning 82%! In terms of time, this bear market is probably the longest of any major stock index since the start of the 20th century. While the size of this decline is sufficient, there could be more bear market yet to come. Price Dimension The bear market into the 2008 bottom took the form of an Elliott wave double zigzag. Figure 1 depicts an illustration of the double zigzag. |
|
| Figure 1: Elliot Wave Double Zigzag Pattern: In this pattern, each zigzag is separated by an intervening "three". |
| Graphic provided by: Mark Rivest. |
| |
| Now take a look at the chart of the Nikkei 225 (N225) in Figure 2. The index appears to have formed a double zigzag into the 2008 bottom. |

|
| Figure 2: N225 Monthly. Note the double zigzag pattern into the 2008 bottom. |
| Graphic provided by: Yahoo! Finance. |
| |
| On the surface you could say, case closed for this enormous bear market. The N225 is in the process of what could be a multi decade bull market. Or could something else be happening? There are interesting clues that point to a possible different path for this index. The entire bear market was 31,962 points, multiplied by .382 equals 12,209 added to the bottom at 6,994 targets 19,203. The N225 high so far this year is 20,252 which is a .414 retrace, more then 5% above a direct hit at the .382 level. There are no rules for how much leeway should be given to a Fibonacci turn point. A .414 retrace is a bit of a stretch. Is there another significant Fibonacci turn point near the 20,252 level? |
|
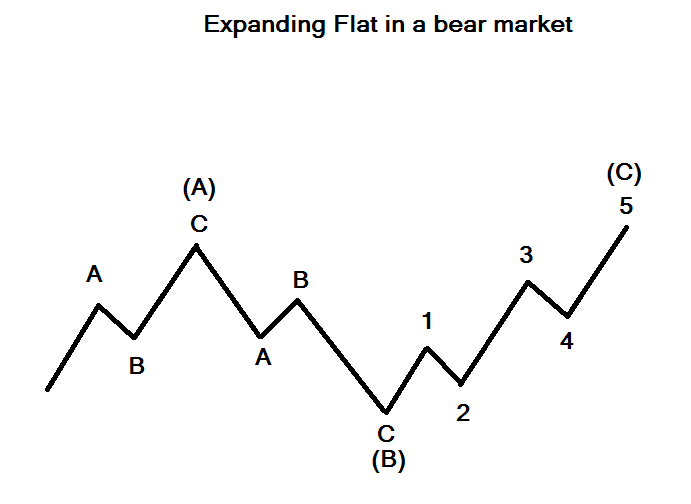
| Figure 3: Expanding Flat. In Expanding Flats, wave B of the 3-3-5 pattern terminates beyond the starting level of wave A and wave C ends beyond the ending level of wave A. |
| Graphic provided by: Mark Rivest. |
| |
| The low made in 2003 was at 7,603. The subsequent rally into the 2007 high was 10,696 points multiplied by 1.236 equals 13,220 added to the 6,994 bottom targets 20,214, which is only 38 points from the high so far this year. Time dimension Shortly after R.N Elliott discovered the wave theory, he realized it was linked to the Fibonacci sequence and ratios. The Fibonacci sequence is as follows: 1,1,2,3,5,8,13,21,34,55,89,144, and so on. He also discovered that several Fibonacci time sequences had occurred in the Dow Jones Industrial Average (DJIA). For example, the bull market from 1932-1937 (five years); the bear market from 1937-1942 (five years); and the bear market from September 1929-July 1932 (34 months). We can see the same phenomenon occurring in the N225. The bear market began in early 1990 and the first zigzag down bottomed in 2003 (13 years); the supposed "X" wave rally followed by the second zigzag down 2003-2008 (five years). There could be yet another Fibonacci time sequence coming in 2016. Robert Prechter in his book "Beautiful Pictures" noted that the DJIA 68 year bull market of 1932-2000 subdivided into two 34 year segments, with the 1966 peak as the midway point. Perhaps the same could happen for the N225, with the bottom of the first zigzag down in 2003 as the midway. There's one other fascinating Fibonacci time sequence for the N225. The start of the supposed expanding flat wave "X" was April 2003 the end of the structure is April 2015, (144 months). An illustration of an expanding flat pattern can be seen in Figure 3. Conclusion The typical relationship of wave "C" to wave "A" within an expanding flat is for wave "C" to have a ratio of 1.236 to wave "A". This is what happened for the supposed N225 expanding flat wave "X". The entire structure is 144 months. These are important clues that tell us the N225 is leaving open the option to break below the 2008 bottom sometime in 2016. If this doesn't happen, the next best count is that the five waves up from the 2008 bottom are wave "1" of a much larger bull market that would probably go on for decades. Reaching the significant Fibonacci resistance near 20,215 could mean that wave "2" down has begun. If so, a .618 retrace is the typical level for wave "2" support. This targets 12,060 N225 as a possible bottom. The time forecasts illustrated on the N225 chart may also apply to a possible wave "2" decline. One Final point. In my April 30, 2015 article "Precipice" I noted that all three main US stock indexes have rallied close to major Fibonacci resistance points. I was curious to find out if the N225 has also hit significant Fibonacci resistance during the same general time. It appears a stock decline in the month of May could have a global scope. |
| Further reading: Frost A.J., and Robert Prechter (1985). "Elliott Wave Principle", New Classics Library. Prechter, Robert R., Jr. (2003). "Beautiful Pictures From The Gallery of Phinance", New Classics Library. |
Independent investment advisor, trader and writer. He has written articles for Technical Analysis of Stocks & Commodities, Traders.com Advantage,Futuresmag.com and, Finance Magnates. Author of website Four Dimension Trading.
| Website: | www.fourdimensiontrading.com |
| E-mail address: | markrivest@gmail.com |
Click here for more information about our publications!
Comments

Request Information From Our Sponsors
- StockCharts.com, Inc.
- Candle Patterns
- Candlestick Charting Explained
- Intermarket Technical Analysis
- John Murphy on Chart Analysis
- John Murphy's Chart Pattern Recognition
- John Murphy's Market Message
- MurphyExplainsMarketAnalysis-Intermarket Analysis
- MurphyExplainsMarketAnalysis-Visual Analysis
- StockCharts.com
- Technical Analysis of the Financial Markets
- The Visual Investor
- VectorVest, Inc.
- Executive Premier Workshop
- One-Day Options Course
- OptionsPro
- Retirement Income Workshop
- Sure-Fire Trading Systems (VectorVest, Inc.)
- Trading as a Business Workshop
- VectorVest 7 EOD
- VectorVest 7 RealTime/IntraDay
- VectorVest AutoTester
- VectorVest Educational Services
- VectorVest OnLine
- VectorVest Options Analyzer
- VectorVest ProGraphics v6.0
- VectorVest ProTrader 7
- VectorVest RealTime Derby Tool
- VectorVest Simulator
- VectorVest Variator
- VectorVest Watchdog