HOT TOPICS LIST
- MACD
- Fibonacci
- RSI
- Gann
- ADXR
- Stochastics
- Volume
- Triangles
- Futures
- Cycles
- Volatility
- ZIGZAG
- MESA
- Retracement
- Aroon
INDICATORS LIST
LIST OF TOPICS
PRINT THIS ARTICLE
by Stella Osoba, CMT
There are many tools that the technician can use to help identify technical weakness on a price chart. Indicators used correctly can provide invaluable information.
Position: N/A
Stella Osoba, CMT
Stella Osoba is a trader and financial writer. She is a frequent contributor to "Technical Analysis of Stocks and Commodities" magazine and "Traders.com Advantage" as well as other financial publications.
PRINT THIS ARTICLE
TECHNICAL ANALYSIS
Anatomy Of A Breakdown (Part 2)
02/04/15 04:33:54 PMby Stella Osoba, CMT
There are many tools that the technician can use to help identify technical weakness on a price chart. Indicators used correctly can provide invaluable information.
Position: N/A
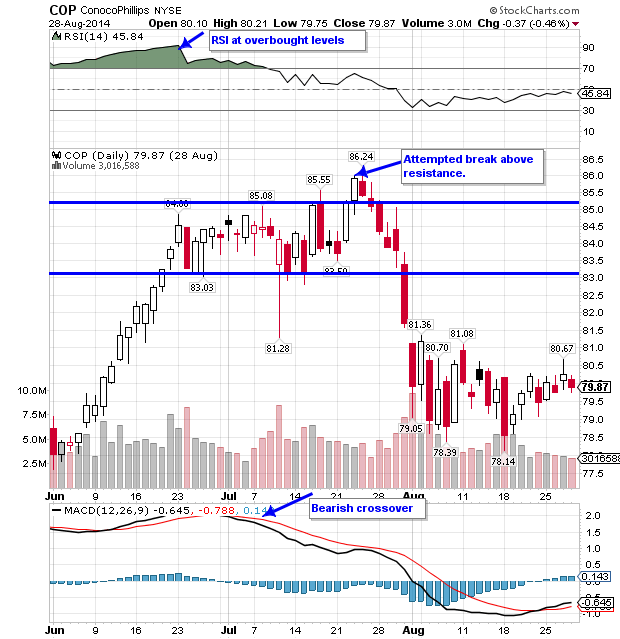
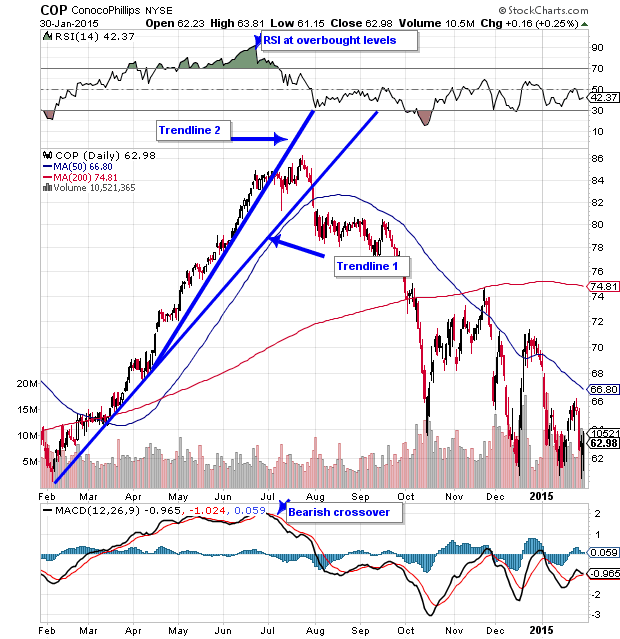
| In the chart of ConocoPhillips (COP), the relative strength index (RSI) and moving average convergence/divergence (MACD) are two useful indicators which can help spot technical weakness on the price chart. On June 23, 2014 when price peaks (see Figure 1), RSI also peaks at very overbought levels. It reaches 90 on June 23. In fact if you were to look back at the price chart, (see Figure 2) at no point in the current trend had RSI reached such overbought levels. When an oscillator like RSI moves to such overbought levels, it is likely that a reversal will occur. It is important to note here that the RSI cannot tell you when the eventual reversal will occur. This is why the RSI should only be used to give you a signal. Look to the price chart itself for confirmation of that signal. |
| So the RSI is at historic overbought levels for the stock. It then falls steeply as price begins to move sideways. But RSI still stays above the neutral zone of 50. Should you get out of the position? Price continues to trade sideways and breaks through the steeper trend line, which is Trendline2 (see Figure 2). RSI continues to fall and notice that it makes a series of three peaks, each lower than the last. This is another bearish indication. |

|
| Figure 1. Confirming Indicators. On June 23, 2014 price and the relative strength index (RSI) peak. As price trades sideways, a bearish crossover in the moving average convergence/divergence (MACD) takes place. Price fails to hold above resistance and then continues falling. |
| Graphic provided by: StockCharts.com. |
| |
| The other indicator which we will use to aid us in our interpretation of what is happening on the price chart is the MACD. As price trades sideways, a bearish crossover in the MACD happens (see Figure 1). A bearish crossover is when the MACD line crosses under the signal line. |

|
| Figure 2. Adding Trendlines. Price breaks through the steeper trendline, the RSI continues to fall and makes a series of lower peaks. These are bearish indications. |
| Graphic provided by: StockCharts.com. |
| |
| Perhaps one signal is not enough to make a decision about whether to get out of a position, but when several signals all point to bearish action, then it is time to pay attention and believe what you see. As the channel continues to form on the price chart, there is yet another signal which points to technical weakness in the price chart. This is the failure of price to hold above resistance. On July 23, 2014, price breaks out above the upper channel, but fails the next day (See Figure 1). The following day price falls back into the channel and continues falling eventually slicing through Trendline1. Learn to spot signs of technical weakness early to aid you in making correct buy & sell decisions. See Also: Anatomy Of A Breakdown (Part 1) |
Stella Osoba is a trader and financial writer. She is a frequent contributor to "Technical Analysis of Stocks and Commodities" magazine and "Traders.com Advantage" as well as other financial publications.
| E-mail address: | stellaosoba@gmail.com |
Click here for more information about our publications!
Comments

Request Information From Our Sponsors
- StockCharts.com, Inc.
- Candle Patterns
- Candlestick Charting Explained
- Intermarket Technical Analysis
- John Murphy on Chart Analysis
- John Murphy's Chart Pattern Recognition
- John Murphy's Market Message
- MurphyExplainsMarketAnalysis-Intermarket Analysis
- MurphyExplainsMarketAnalysis-Visual Analysis
- StockCharts.com
- Technical Analysis of the Financial Markets
- The Visual Investor
- VectorVest, Inc.
- Executive Premier Workshop
- One-Day Options Course
- OptionsPro
- Retirement Income Workshop
- Sure-Fire Trading Systems (VectorVest, Inc.)
- Trading as a Business Workshop
- VectorVest 7 EOD
- VectorVest 7 RealTime/IntraDay
- VectorVest AutoTester
- VectorVest Educational Services
- VectorVest OnLine
- VectorVest Options Analyzer
- VectorVest ProGraphics v6.0
- VectorVest ProTrader 7
- VectorVest RealTime Derby Tool
- VectorVest Simulator
- VectorVest Variator
- VectorVest Watchdog
