

HOT TOPICS LIST
- MACD
- Fibonacci
- RSI
- Gann
- ADXR
- Stochastics
- Volume
- Triangles
- Futures
- Cycles
- Volatility
- ZIGZAG
- MESA
- Retracement
- Aroon
INDICATORS LIST
LIST OF TOPICS
PRINT THIS ARTICLE
by Stella Osoba, CMT
To successfully identify a break down as it begins to happen, it is essential to learn to look for signs of technical weakness on the chart.
Position: N/A
Stella Osoba, CMT
Stella Osoba is a trader and financial writer. She is a frequent contributor to "Technical Analysis of Stocks and Commodities" magazine and "Traders.com Advantage" as well as other financial publications.
PRINT THIS ARTICLE
TECHNICAL ANALYSIS
Anatomy Of A Breakdown (Part 1)
01/28/15 04:19:01 PMby Stella Osoba, CMT
To successfully identify a break down as it begins to happen, it is essential to learn to look for signs of technical weakness on the chart.
Position: N/A
| A breakdown happens after a sustained up trend. It is often when the stories in the news surrounding the stock are at their most optimistic that the vigilant technician can begin to spot signs of a technical breakdown in the stock. |
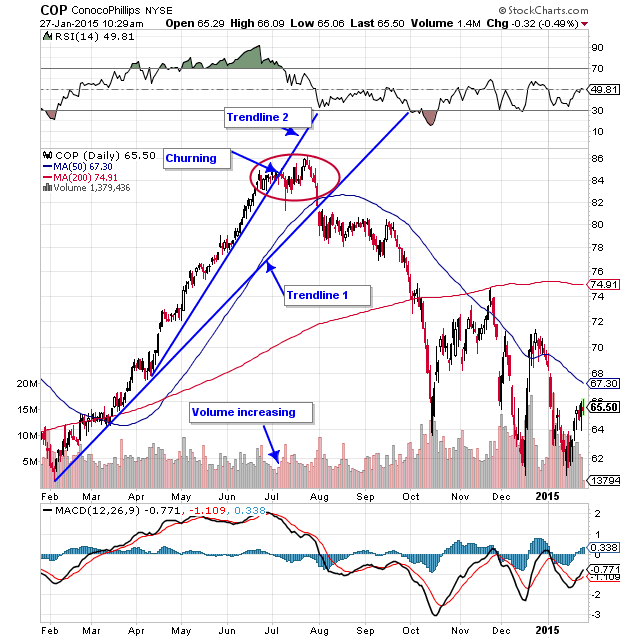
| For example, from February 2014 until June 2014, ConocoPhillips (COP) was in an uptrend. An up trendline drawn from the lows in February shows a steepening trend as COP moves away from the trend line. A second steeper trend line drawn from mid-April shows increasing momentum. This sort of price action will attract attention which will often cause even steeper price increases in a feedback loop. However, as price moves away from its 50-day moving average, signs of a technical breakdown begin to appear. |
|
| Figure 1. Whenever there is a steep up trend, it will attract the attention of traders and investors. When price starts moving away from the 50-day moving average, you start seeing signs of a technical breakdown. |
| Graphic provided by: StockCharts.com. |
| |
| On June 23, 2014, price closed at $84.54. The following day, the stock closed lower on higher volume. For the next month the stock traded sideways. It is at times like these that the observant trader will look for signs of churning. Churning happens when big investors, often institutional investors sell into an uptrend. Often, since the smaller investors still think that the uptrend is in effect, their buying will take up the selling, therefore concealing the activity of the big players. This kind of action can be spotted on the chart as days or weeks when there is strong and above average volume but price makes little or no progress. From July 7, 2014 until and including July 10, 2014 volume steadily increases but on each of these days price closes at $84. This is churning in action. Spotting this, the next course of action would be to get out of the stock, failing this or needing more confirmation, you could raise your stops. In any case this would not be a good time to enter the position in the hopes of buying during a pause in the uptrend. |
| On July 23, 2014 price tried to break out of the range, but failed the next day. A series of lower closes over the next few days saw price break through its 50-day moving average and then through a major trendline, marked Trendline 1 in Figure 1. Now it is clear that the stock is in trouble. But as early as July 10, 2014 you had evidence of this and could have exited the position at a more favorable price. |
Stella Osoba is a trader and financial writer. She is a frequent contributor to "Technical Analysis of Stocks and Commodities" magazine and "Traders.com Advantage" as well as other financial publications.
| E-mail address: | stellaosoba@gmail.com |
Click here for more information about our publications!
Comments

Request Information From Our Sponsors
- StockCharts.com, Inc.
- Candle Patterns
- Candlestick Charting Explained
- Intermarket Technical Analysis
- John Murphy on Chart Analysis
- John Murphy's Chart Pattern Recognition
- John Murphy's Market Message
- MurphyExplainsMarketAnalysis-Intermarket Analysis
- MurphyExplainsMarketAnalysis-Visual Analysis
- StockCharts.com
- Technical Analysis of the Financial Markets
- The Visual Investor
- VectorVest, Inc.
- Executive Premier Workshop
- One-Day Options Course
- OptionsPro
- Retirement Income Workshop
- Sure-Fire Trading Systems (VectorVest, Inc.)
- Trading as a Business Workshop
- VectorVest 7 EOD
- VectorVest 7 RealTime/IntraDay
- VectorVest AutoTester
- VectorVest Educational Services
- VectorVest OnLine
- VectorVest Options Analyzer
- VectorVest ProGraphics v6.0
- VectorVest ProTrader 7
- VectorVest RealTime Derby Tool
- VectorVest Simulator
- VectorVest Variator
- VectorVest Watchdog