HOT TOPICS LIST
- MACD
- Fibonacci
- RSI
- Gann
- ADXR
- Stochastics
- Volume
- Triangles
- Futures
- Cycles
- Volatility
- ZIGZAG
- MESA
- Retracement
- Aroon
INDICATORS LIST
LIST OF TOPICS
PRINT THIS ARTICLE
by Matt Blackman
Intermarket analysis tells us that stocks, bonds, and commodities generally move together in trends. Was does it mean when they don't?
Position: N/A
Matt Blackman
Matt Blackman is a full-time technical and financial writer and trader. He produces corporate and financial newsletters, and assists clients in getting published in the mainstream media. He is the host of TradeSystemGuru.com. Matt has earned the Chartered Market Technician (CMT) designation. Find out what stocks and futures Matt is watching on Twitter at www.twitter.com/RatioTrade
PRINT THIS ARTICLE
DIVERGENCE INDEX
What Does The Stock-Commodity Disconnect Mean For Markets?
01/12/15 04:52:43 PMby Matt Blackman
Intermarket analysis tells us that stocks, bonds, and commodities generally move together in trends. Was does it mean when they don't?
Position: N/A
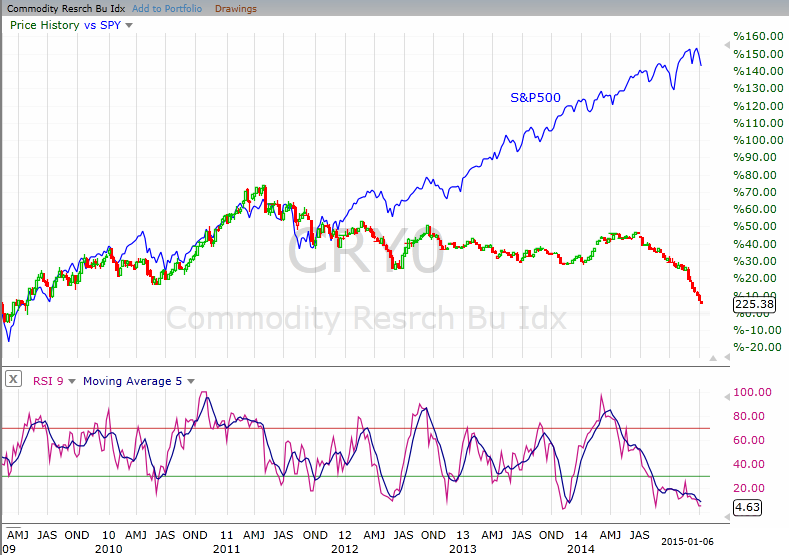
| Not only oil and energy related commodities, but a wide array of commodities have been experiencing weakness compared to US stocks. As I demonstrated in my latest TCA article entitled "The Crude-Natural Gas Disconnect," both oil and natural gas began to noticeably weaken in early 2014 albeit at different rates. However, a number of commodities have struggled since 2011. As you see in Figure 1, the Commodity Research Bureau Index (CRY0) began to diverge from the S&P 500 index in late 2011 after both suffered a correction. But as we see from Figure 1, stocks reversed to eventually hit a series of new all-time highs two years later while commodities continued their downtrend. To the trader, this begs the obvious question, what has happened in the past when stocks & commodities have significantly diverged? |

|
| Figure 1. A Divergence Between Stocks & Commodities. Here you see the weekly chart of the Cmmodity Research Bureau Index (CRY0) together with the S&P 500 index showing how they diverged in 2012. |
| Graphic provided by: Freestockcharts.com. |
| |
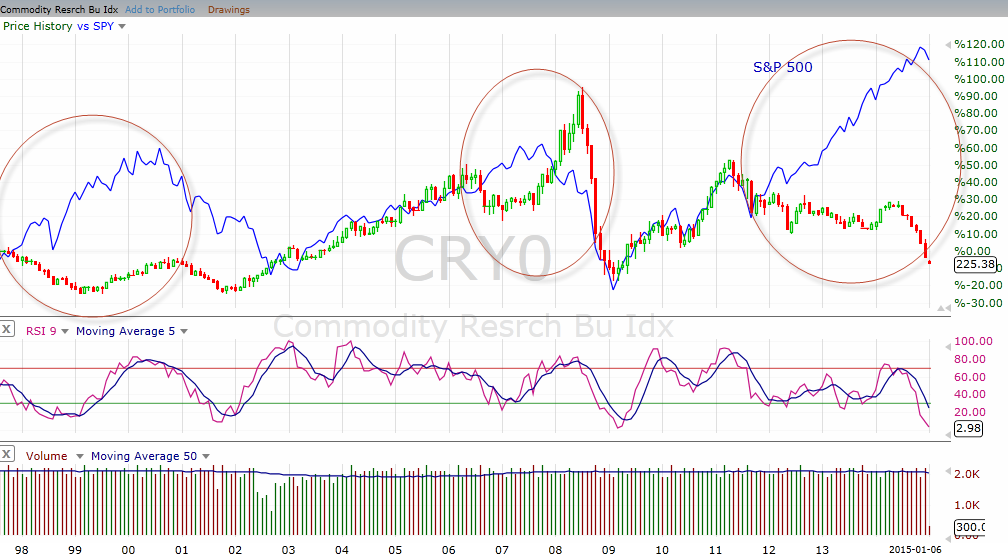
| As you see in the chart in Figure 2, this has occurred twice before in the last two decades — once in 1998 when stocks & commodities diverged and again in 2006 when a similar divergence occurred. Note that after initially correcting in both those cases, commodities recovered again before they both fell again with the onset of recessions. |

|
| Figure 2. What History Shows. Here you see a monthly chart showing the prior two instances when US stocks & commodities diverged from one another — first in 1998 and again in 2006. The latest divergence that began in late 2011 is already three years old. |
| Graphic provided by: Freestockcharts.com. |
| |
| To paraphrase Samuel Clements, history doesn't repeat itself but it does rhyme. The latest stock-commodity divergence is now more than two years old and only time will tell if the latest top in the S&P 500 is the end of the rally. But if this scenario is to play out as it did in 1998 and 2006, commodities should (but not necessarily) stage some sort of rally before stocks roll over. |
| Each time markets get out of whack there are calls from so-called experts that this time is different. And each time history has proven them wrong. The big question now is when? |
Matt Blackman is a full-time technical and financial writer and trader. He produces corporate and financial newsletters, and assists clients in getting published in the mainstream media. He is the host of TradeSystemGuru.com. Matt has earned the Chartered Market Technician (CMT) designation. Find out what stocks and futures Matt is watching on Twitter at www.twitter.com/RatioTrade
| Company: | TradeSystemGuru.com |
| Address: | Box 2589 |
| Garibaldi Highlands, BC Canada | |
| Phone # for sales: | 604-898-9069 |
| Fax: | 604-898-9069 |
| Website: | www.tradesystemguru.com |
| E-mail address: | indextradermb@gmail.com |
Traders' Resource Links | |
| TradeSystemGuru.com has not added any product or service information to TRADERS' RESOURCE. | |
Click here for more information about our publications!
PRINT THIS ARTICLE

Request Information From Our Sponsors
- VectorVest, Inc.
- Executive Premier Workshop
- One-Day Options Course
- OptionsPro
- Retirement Income Workshop
- Sure-Fire Trading Systems (VectorVest, Inc.)
- Trading as a Business Workshop
- VectorVest 7 EOD
- VectorVest 7 RealTime/IntraDay
- VectorVest AutoTester
- VectorVest Educational Services
- VectorVest OnLine
- VectorVest Options Analyzer
- VectorVest ProGraphics v6.0
- VectorVest ProTrader 7
- VectorVest RealTime Derby Tool
- VectorVest Simulator
- VectorVest Variator
- VectorVest Watchdog
- StockCharts.com, Inc.
- Candle Patterns
- Candlestick Charting Explained
- Intermarket Technical Analysis
- John Murphy on Chart Analysis
- John Murphy's Chart Pattern Recognition
- John Murphy's Market Message
- MurphyExplainsMarketAnalysis-Intermarket Analysis
- MurphyExplainsMarketAnalysis-Visual Analysis
- StockCharts.com
- Technical Analysis of the Financial Markets
- The Visual Investor
