

HOT TOPICS LIST
- MACD
- Fibonacci
- RSI
- Gann
- ADXR
- Stochastics
- Volume
- Triangles
- Futures
- Cycles
- Volatility
- ZIGZAG
- MESA
- Retracement
- Aroon
INDICATORS LIST
LIST OF TOPICS
PRINT THIS ARTICLE
by Matt Blackman
Oil prices took a big dive in late 2014. But any recovery probably won't benefit natural gas or LNG prices much.
Position: N/A
Matt Blackman
Matt Blackman is a full-time technical and financial writer and trader. He produces corporate and financial newsletters, and assists clients in getting published in the mainstream media. He is the host of TradeSystemGuru.com. Matt has earned the Chartered Market Technician (CMT) designation. Find out what stocks and futures Matt is watching on Twitter at www.twitter.com/RatioTrade
PRINT THIS ARTICLE
ENERGY
The Crude-Natural Gas Disconnect
01/07/15 12:28:47 PMby Matt Blackman
Oil prices took a big dive in late 2014. But any recovery probably won't benefit natural gas or LNG prices much.
Position: N/A
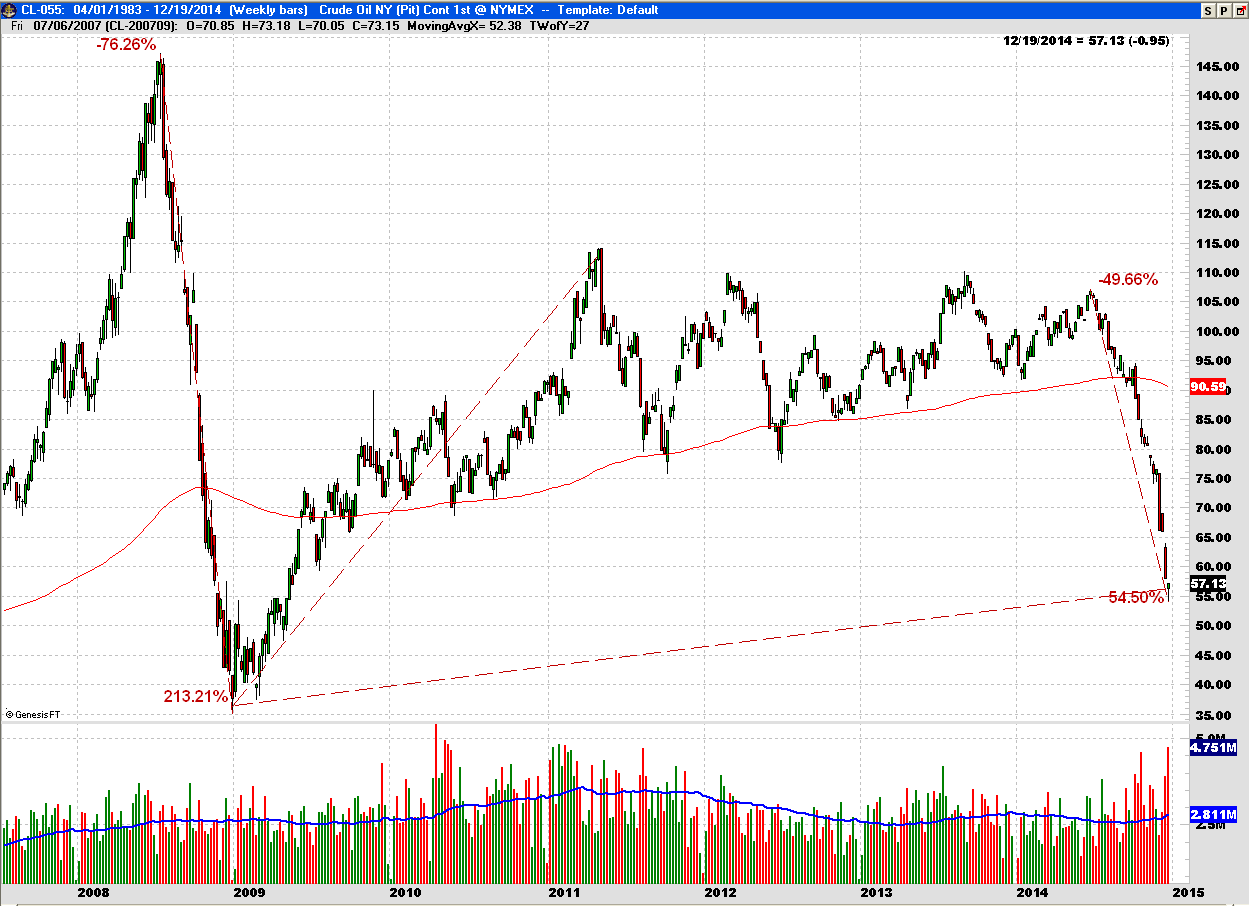
| Energy prices, especially oil, dropped dramatically in the last two quarters of 2014. And while theories for this move range from a weakening economy in China to a conspiracy by western nations and Saudi Arabia to punish Vladimir Putin and other oil supply 'undesirables' such as Venezuela, Iran and Iraq, the real truth has more to do with new shale gas supply from the US, Australia, and Malaysia. However, oil prices have been cut in half in the last six months and this has generated significant global economic impact. As we shall see, the downdraft on natural gas (and LNG) prices has been much more muted. As we see in Figure 1, crude lost 76% after hitting a high of $147 in 2008 and then began rising to just above $107 in June 2014 for a gain of more than 200% before the next big decline began. The five-year average price (red solid line) of $90.59 is significantly higher than both its 2008-09 low near $30 and the recent low below $55. |
|
| Figure 1. Weekly Chart Of Crude Oil Since 2007. After hitting a high of $147 in 2008, crude lost 76% but then began rising before hitting a peak just above $107 in June 2014 after which it gave back 50% of its value. The five-year average price (red solid line) is $90.59, well above its 2008-2009 low near $30 and the recent low around $53. |
| Graphic provided by: Trade Navigator by http://www.tradenavigator.com/. |
| |
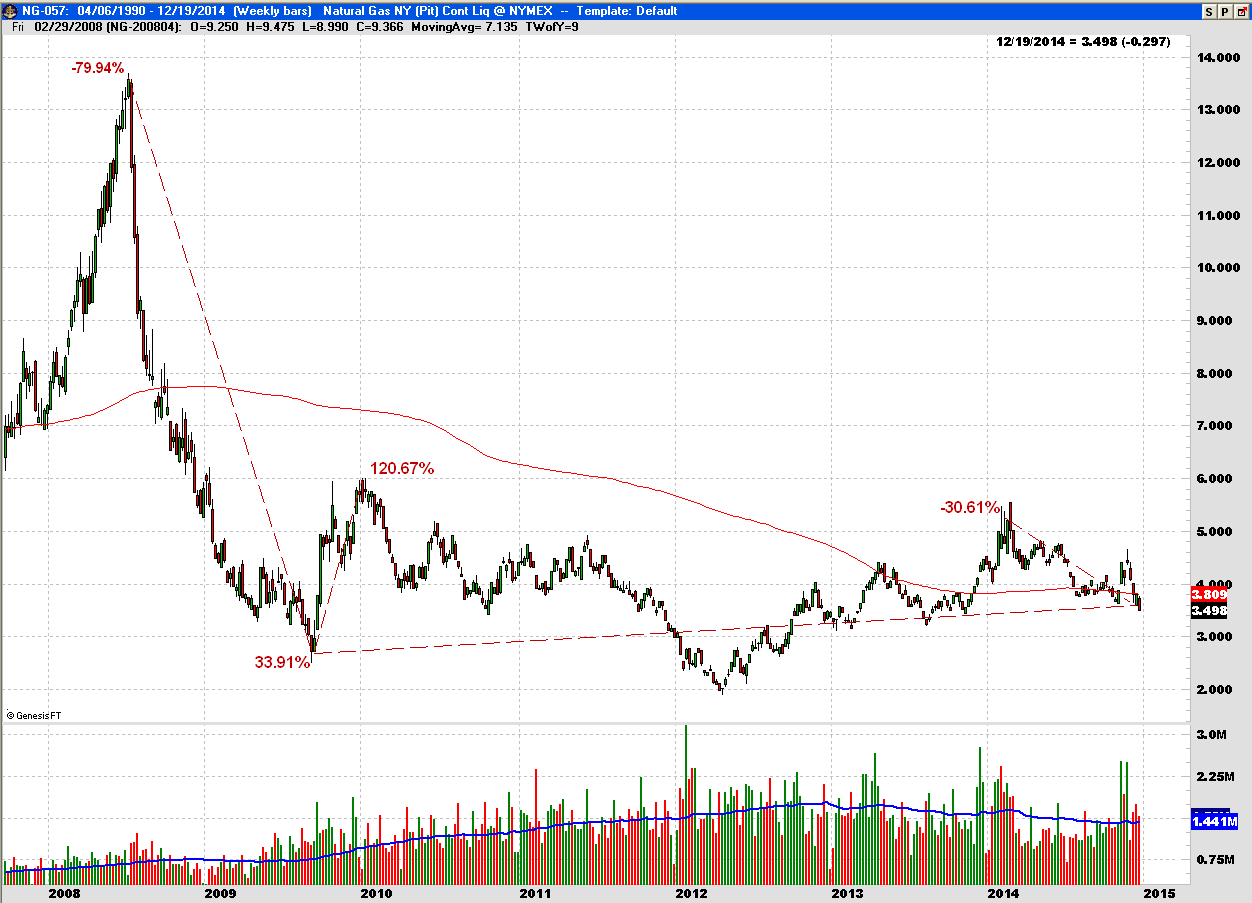
| Now compare Figure 1 with the chart of natural gas in Figure 2. After its 2008 high around $13.50, gas dropped 80% into late 2009 after which prices rose 120%. But that was less than half the jump in crude prices. Also notice that the drop in latter 2014 was much less severe than in oil as demonstrated by natural gas trading just below its five-year average (3.81) at $3.50 on December 19, 2014. In other words, the market for natural gas has been much weaker than oil since 2009. |
|
| Figure 2. Weekly Chart Of Natural Gas. Here you see the performance of natural gas since late 2007. It peaked close to $14 in 2008 followed by an 80% drop into 2009. However, unlike oil, natural gas hasn't enjoyed the same price increase as oil and it's trading close to its five-year average. |
| Graphic provided by: Trade Navigator by http://www.tradenavigator.com/. |
| |
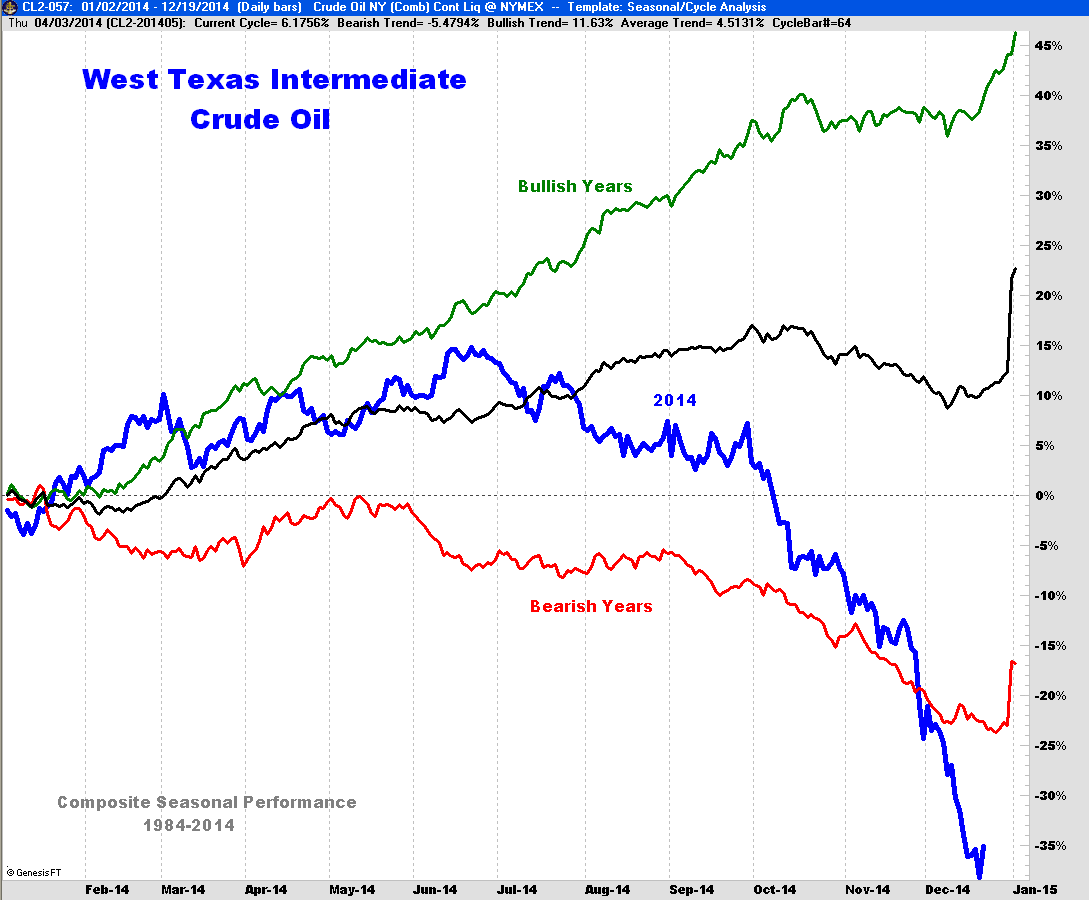
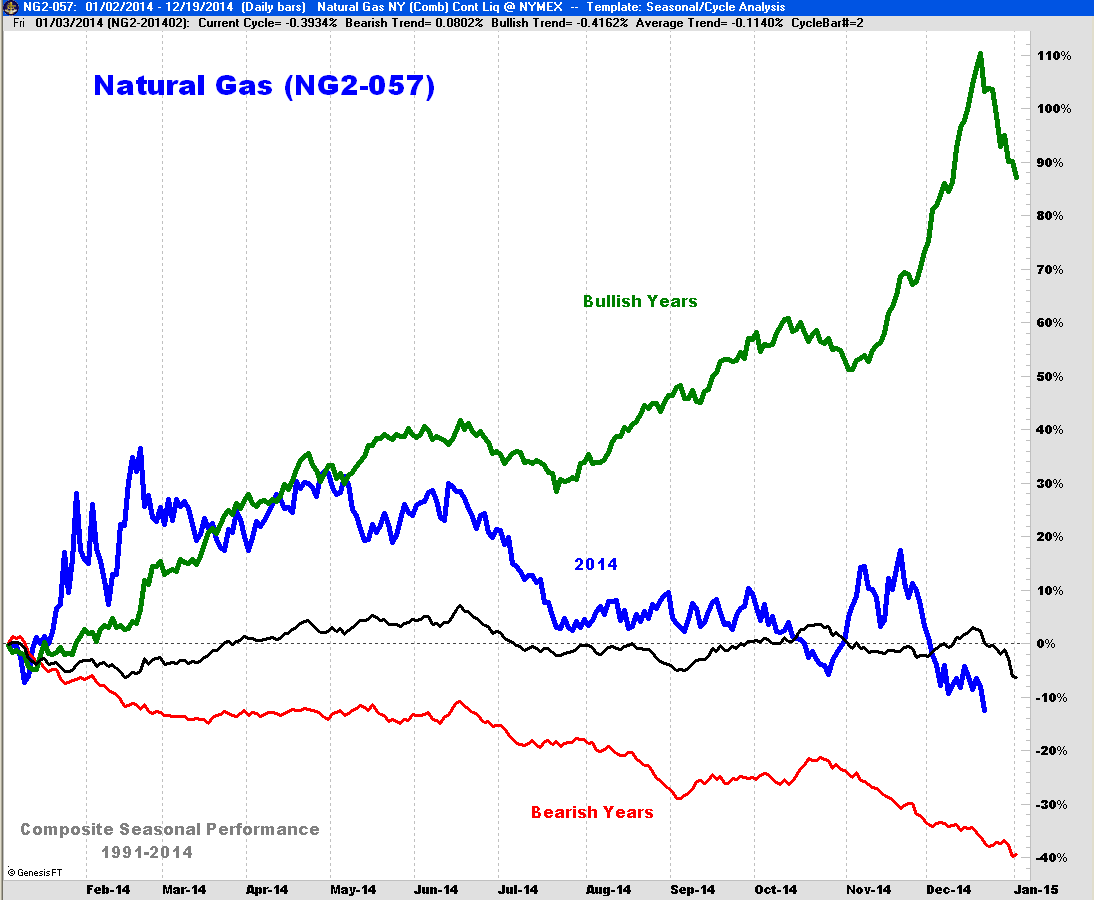
| This difference between the two markets is more clearly seen in their seasonal performance charts. As we see, crude was down more that 35% on the year in December (Figure 3). Contrast this drop with the drop of less than 12% on the year for natural gas (Figure 4). |
|
| Figure 3. Seasonal Performance For Crude Oil. Here you see the good years (green), bad years (red), average annual performance (black), and 2014 performance (blue) of crude oil over the last 30 years. |
| Graphic provided by: Trade Navigator by http://www.tradenavigator.com/. |
| |
| So what is the takeaway for market players? Media commentators have tended to lump energy prices together when talking about weak oil markets. While that may be true on balance, the magnitude of the drops has been different between oil and natural gas and this has serious implications for any rally in the future. |
|
| Figure 4. Seasonal Performance For Natural Gas. Here you see the good years (green), bad years (red), average annual performance (black), and 2014 performance (blue) of natural gas over the last 25 years. In 2014, natural gas was down 12% compared to an average drop of 6% by year-end normally. |
| Graphic provided by: Trade Navigator by http://www.tradenavigator.com/. |
| |
| What this means is that even if oil stages a major rally in 2015, there is a much lower probability that natural gas (and LNG) will partake to the same degree. First, natural gas prices have experienced a much shallower decline and second, thanks to the shale gas boom in the US and elsewhere, there is much more supply available now and into the future as new production comes on stream. This reality does not bode well for new liquid natural gas (LNG) suppliers in Canada and elsewhere, especially considering that it costs approximately $6.50 per million British Thermal Units to process, transport, and cool natural gas to the -162 Celsius to make it into LNG. This means that producers must get at least $10/million BTUs (or 280% of the cost of US natural gas at currently prices) just to break even! The International Energy Agency (IEA) recently estimated that Canadian LNG will be among the most expensive in the world (with Australia) and estimated it would cost producers between $13 and $14/mBTUs to get it to Asian markets. Compare this with a spot price on December 22, 2014 of $10/mBTUs delivered in Asia according to LNGJournal.com. Given the current plans for new production, the IEA has forecasted that Asian LNG prices will range between $8 and $12 for the foreseeable future. |
Matt Blackman is a full-time technical and financial writer and trader. He produces corporate and financial newsletters, and assists clients in getting published in the mainstream media. He is the host of TradeSystemGuru.com. Matt has earned the Chartered Market Technician (CMT) designation. Find out what stocks and futures Matt is watching on Twitter at www.twitter.com/RatioTrade
| Company: | TradeSystemGuru.com |
| Address: | Box 2589 |
| Garibaldi Highlands, BC Canada | |
| Phone # for sales: | 604-898-9069 |
| Fax: | 604-898-9069 |
| Website: | www.tradesystemguru.com |
| E-mail address: | indextradermb@gmail.com |
Traders' Resource Links | |
| TradeSystemGuru.com has not added any product or service information to TRADERS' RESOURCE. | |
Click here for more information about our publications!
Comments

Request Information From Our Sponsors
- StockCharts.com, Inc.
- Candle Patterns
- Candlestick Charting Explained
- Intermarket Technical Analysis
- John Murphy on Chart Analysis
- John Murphy's Chart Pattern Recognition
- John Murphy's Market Message
- MurphyExplainsMarketAnalysis-Intermarket Analysis
- MurphyExplainsMarketAnalysis-Visual Analysis
- StockCharts.com
- Technical Analysis of the Financial Markets
- The Visual Investor
- VectorVest, Inc.
- Executive Premier Workshop
- One-Day Options Course
- OptionsPro
- Retirement Income Workshop
- Sure-Fire Trading Systems (VectorVest, Inc.)
- Trading as a Business Workshop
- VectorVest 7 EOD
- VectorVest 7 RealTime/IntraDay
- VectorVest AutoTester
- VectorVest Educational Services
- VectorVest OnLine
- VectorVest Options Analyzer
- VectorVest ProGraphics v6.0
- VectorVest ProTrader 7
- VectorVest RealTime Derby Tool
- VectorVest Simulator
- VectorVest Variator
- VectorVest Watchdog