

HOT TOPICS LIST
- MACD
- Fibonacci
- RSI
- Gann
- ADXR
- Stochastics
- Volume
- Triangles
- Futures
- Cycles
- Volatility
- ZIGZAG
- MESA
- Retracement
- Aroon
INDICATORS LIST
LIST OF TOPICS
PRINT THIS ARTICLE
by Donald W. Pendergast, Jr.
With its bear market rally now complete, shares of Netflix, Inc. prepare to turn lower once more.
Position: N/A
Donald W. Pendergast, Jr.
Freelance financial markets writer and online publisher of the Trendzetterz.com S&P 500 Weekly Forecast service.
PRINT THIS ARTICLE
NFLX: Cycle High Complete, Decline Ahead?
11/07/14 05:33:56 PMby Donald W. Pendergast, Jr.
With its bear market rally now complete, shares of Netflix, Inc. prepare to turn lower once more.
Position: N/A
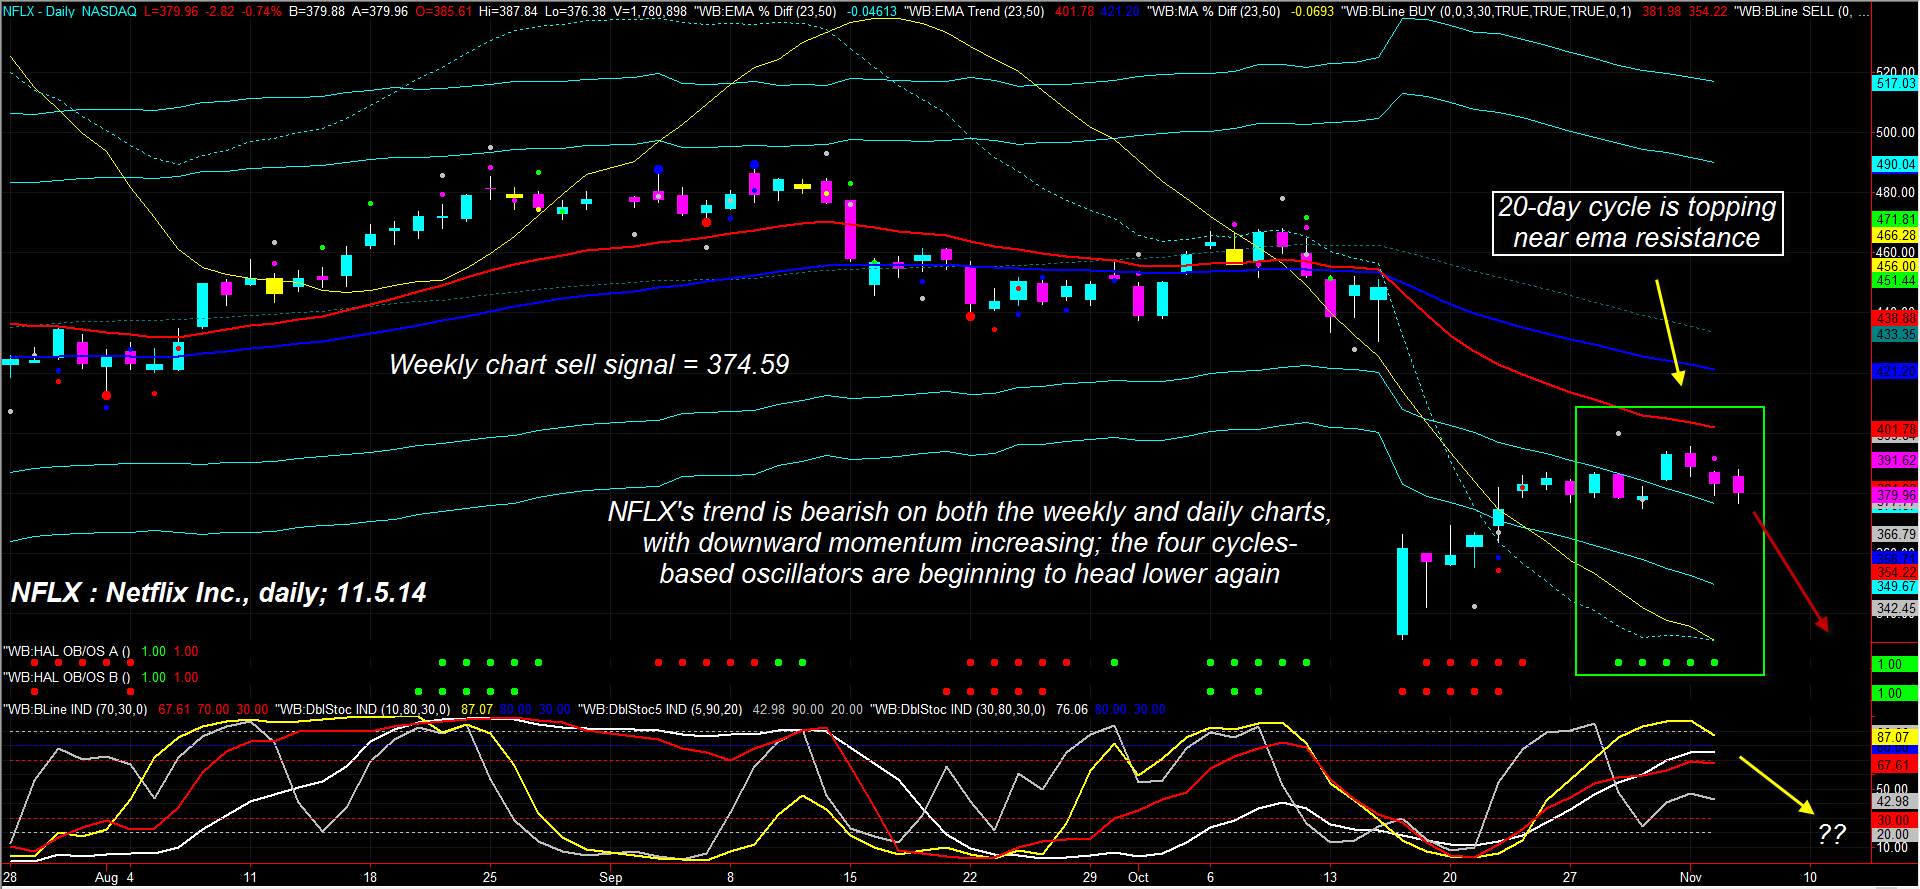
| After retracing nearly 50% of its vicious October 2014 sell-off, shares of Netflix, Inc. (NFLX) appear to have begun a fresh turn lower, with powerful weekly chart momentum ready to push the stock lower. |
|
| Figure 1. More Room To Fall. Netflix Inc. (NFLX) appears to be setting up for a 'short rallies in bear markets' trade; momentum is very bearish on the daily (seen here) and weekly time frames. |
| Graphic provided by: TradeStation. |
| Graphic provided by: ProfitTrader 7 from www.walterbressert.com. |
| |
| When a widely followed large cap stock gaps down by 25% on earnings related news, it's a big deal to Wall Street, long-term investors, and traders; there are so many questions after such an event and the future pathway of prices can be confusing to forecast. While no one could have envisioned beforehand how deep and fast a potential NFLX decline might be, as technicians we have many valuable tools that can make the job much easier. So here are the factors that almost unanimously agreed that the line of least resistance for NFLX going into 2015 is toward substantially lower valuations (see Figure 1): 1. The stock has now retraced nearly 50% of its October 2014 rout. 2. Its 10-day detrend histogram (not shown) is depicting a hidden (bearish) divergence. 3. The spread between the red and blue exponential moving averages (EMA) shows increasing bearish momentum on the daily and weekly charts. 4. NFLX rose to 395.52 on the bearish bounce and has now entered a probable time window (green OB dots) in which to turn south once again. 5. A confirmed daily sell signal occurs on the next drop beneath 376.38 and on the weekly chart the number to watch is 374.60 — with a major weekly sell signal also at 331.00. 6. Elliott Wave analysis also confirms that the September 2014 high at 489.29 is the end of a major five-wave impulse pattern and that the next major support zone for NFLX is between 300.00 and 320.00 (see my TCA article from September 26, 2014 entitled "NFLX: Major Weekly Chart Pattern"). 7. Fibonacci swing analysis also reveals that the 310.00 area is the minimum logical price target for the developing swing CD on the weekly chart. Essentially, the pattern shown here is a bear market bounce cycle high forming against the background of highly negative price momentum — and that means the old rule of 'sell rallies in bear markets' certainly holds true right here in NFLX. |
|
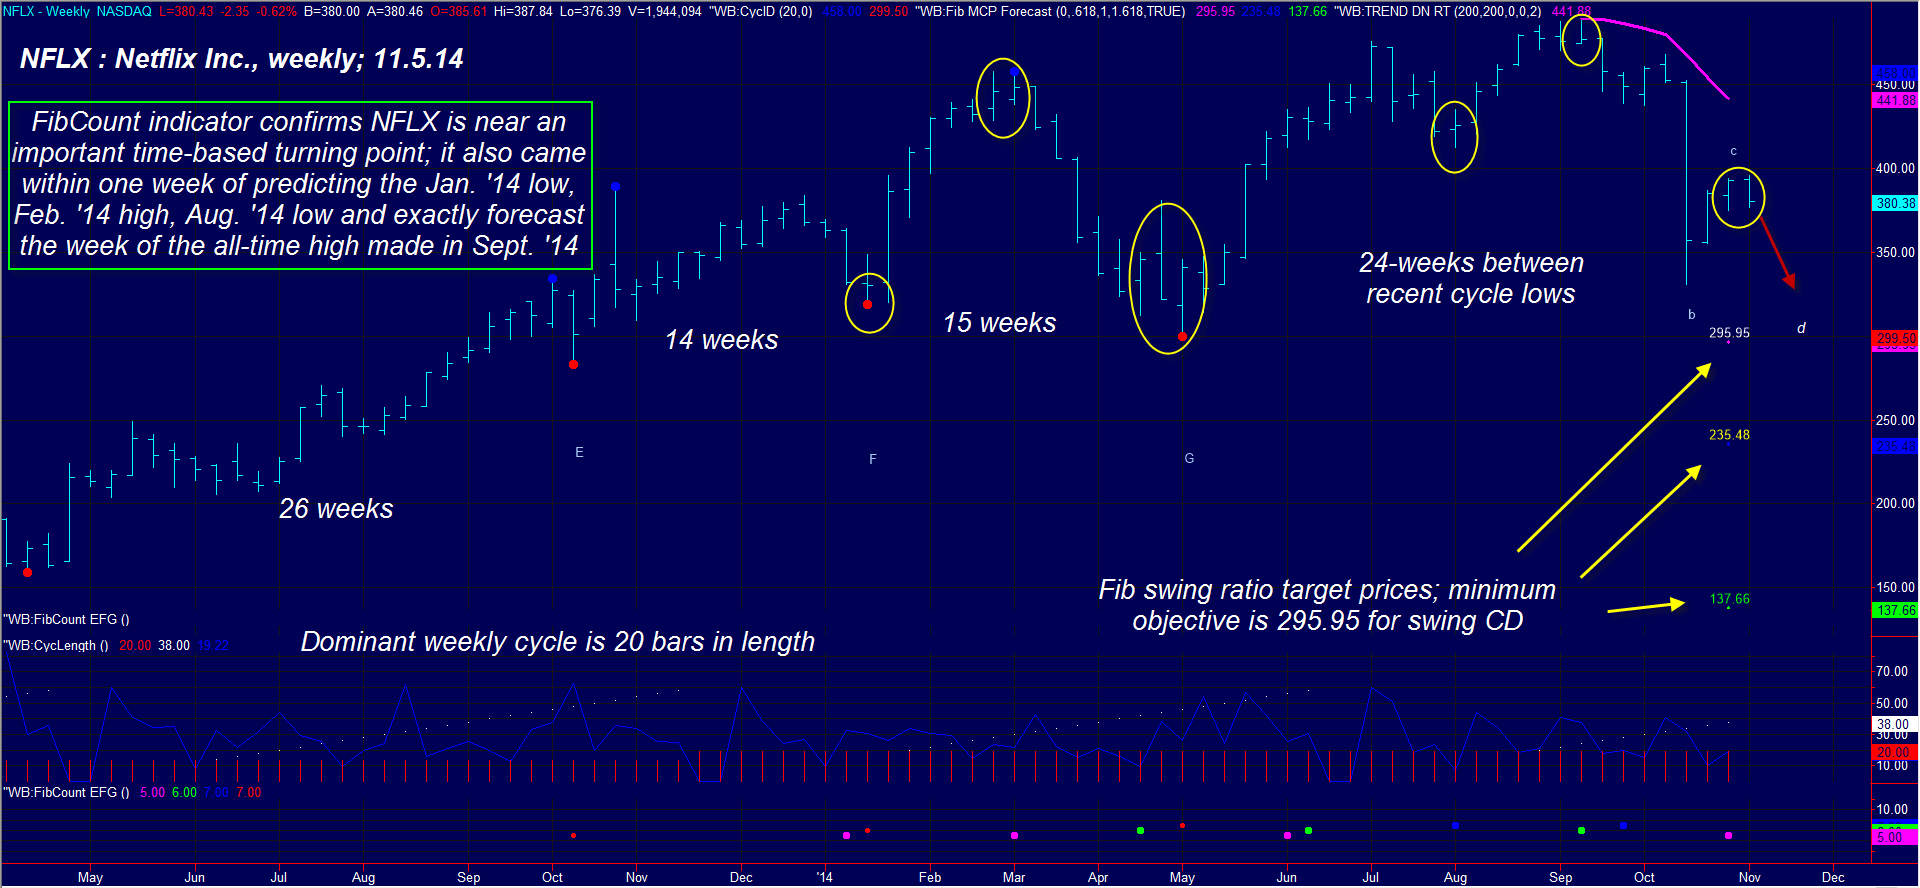
| Figure 2. Confirmation On The Weekly Chart. The FibCount forecast for NFLX's weekly chart has proven very accurate in 2014; the indicator forecasted the week ending October 31, 2014 as a likely major turning point for the stock — back in May 2014. |
| Graphic provided by: TradeStation. |
| Graphic provided by: ProfitTrader 7 from www.walterbressert.com. |
| |
| Here are the current time windows in which to anticipate the next 20-day/20-week cycle lows for NFLX: 1. For the daily time frame it's from November 21, 2014 to November 28, 2014. 2. For the weekly time frame it's from January 23-February 27, 2015. These can be useful dates to be aware of, particularly if NFLX does indeed bottom near 300.00-310.00 within the weekly cycle low time forecast window. There may be several tradable reactions en route to such lower price areas, but as long as the daily and weekly momentum remains bearish, NFLX looks like a potential money-maker on the short side over the next one to three months — at a minimum. Note the chart in Figure 2 — the FibCount indicator (colored dots at bottom of chart) does a good job at forecasting Fibonacci time cycles and usually calls a key turning point with a +1/-1 accuracy; the current forecast picked last week's price bars as the turn point for the current cycle. Trade wisely until we meet here again. |
Freelance financial markets writer and online publisher of the Trendzetterz.com S&P 500 Weekly Forecast service.
| Title: | Market consultant and writer |
| Company: | Trendzetterz |
| Address: | 81 Hickory Hollow Drive |
| Crossville, TN 38555 | |
| Phone # for sales: | 904-303-4814 |
| Website: | trendzetterz.com |
| E-mail address: | support@trendzetterz.com |
Traders' Resource Links | |
| Trendzetterz has not added any product or service information to TRADERS' RESOURCE. | |
Click here for more information about our publications!
PRINT THIS ARTICLE

Request Information From Our Sponsors
- VectorVest, Inc.
- Executive Premier Workshop
- One-Day Options Course
- OptionsPro
- Retirement Income Workshop
- Sure-Fire Trading Systems (VectorVest, Inc.)
- Trading as a Business Workshop
- VectorVest 7 EOD
- VectorVest 7 RealTime/IntraDay
- VectorVest AutoTester
- VectorVest Educational Services
- VectorVest OnLine
- VectorVest Options Analyzer
- VectorVest ProGraphics v6.0
- VectorVest ProTrader 7
- VectorVest RealTime Derby Tool
- VectorVest Simulator
- VectorVest Variator
- VectorVest Watchdog
- StockCharts.com, Inc.
- Candle Patterns
- Candlestick Charting Explained
- Intermarket Technical Analysis
- John Murphy on Chart Analysis
- John Murphy's Chart Pattern Recognition
- John Murphy's Market Message
- MurphyExplainsMarketAnalysis-Intermarket Analysis
- MurphyExplainsMarketAnalysis-Visual Analysis
- StockCharts.com
- Technical Analysis of the Financial Markets
- The Visual Investor