

HOT TOPICS LIST
- MACD
- Fibonacci
- RSI
- Gann
- ADXR
- Stochastics
- Volume
- Triangles
- Futures
- Cycles
- Volatility
- ZIGZAG
- MESA
- Retracement
- Aroon
INDICATORS LIST
LIST OF TOPICS
PRINT THIS ARTICLE
by Donald W. Pendergast, Jr.
Using weekly charts to locate high probability patterns on the verge of a new swing/trend move can be time well spent.
Position: N/A
Donald W. Pendergast, Jr.
Freelance financial markets writer and online publisher of the Trendzetterz.com S&P 500 Weekly Forecast service.
PRINT THIS ARTICLE
CHART ANALYSIS
NFLX: Major Weekly Chart Pattern
10/01/14 03:26:45 PMby Donald W. Pendergast, Jr.
Using weekly charts to locate high probability patterns on the verge of a new swing/trend move can be time well spent.
Position: N/A
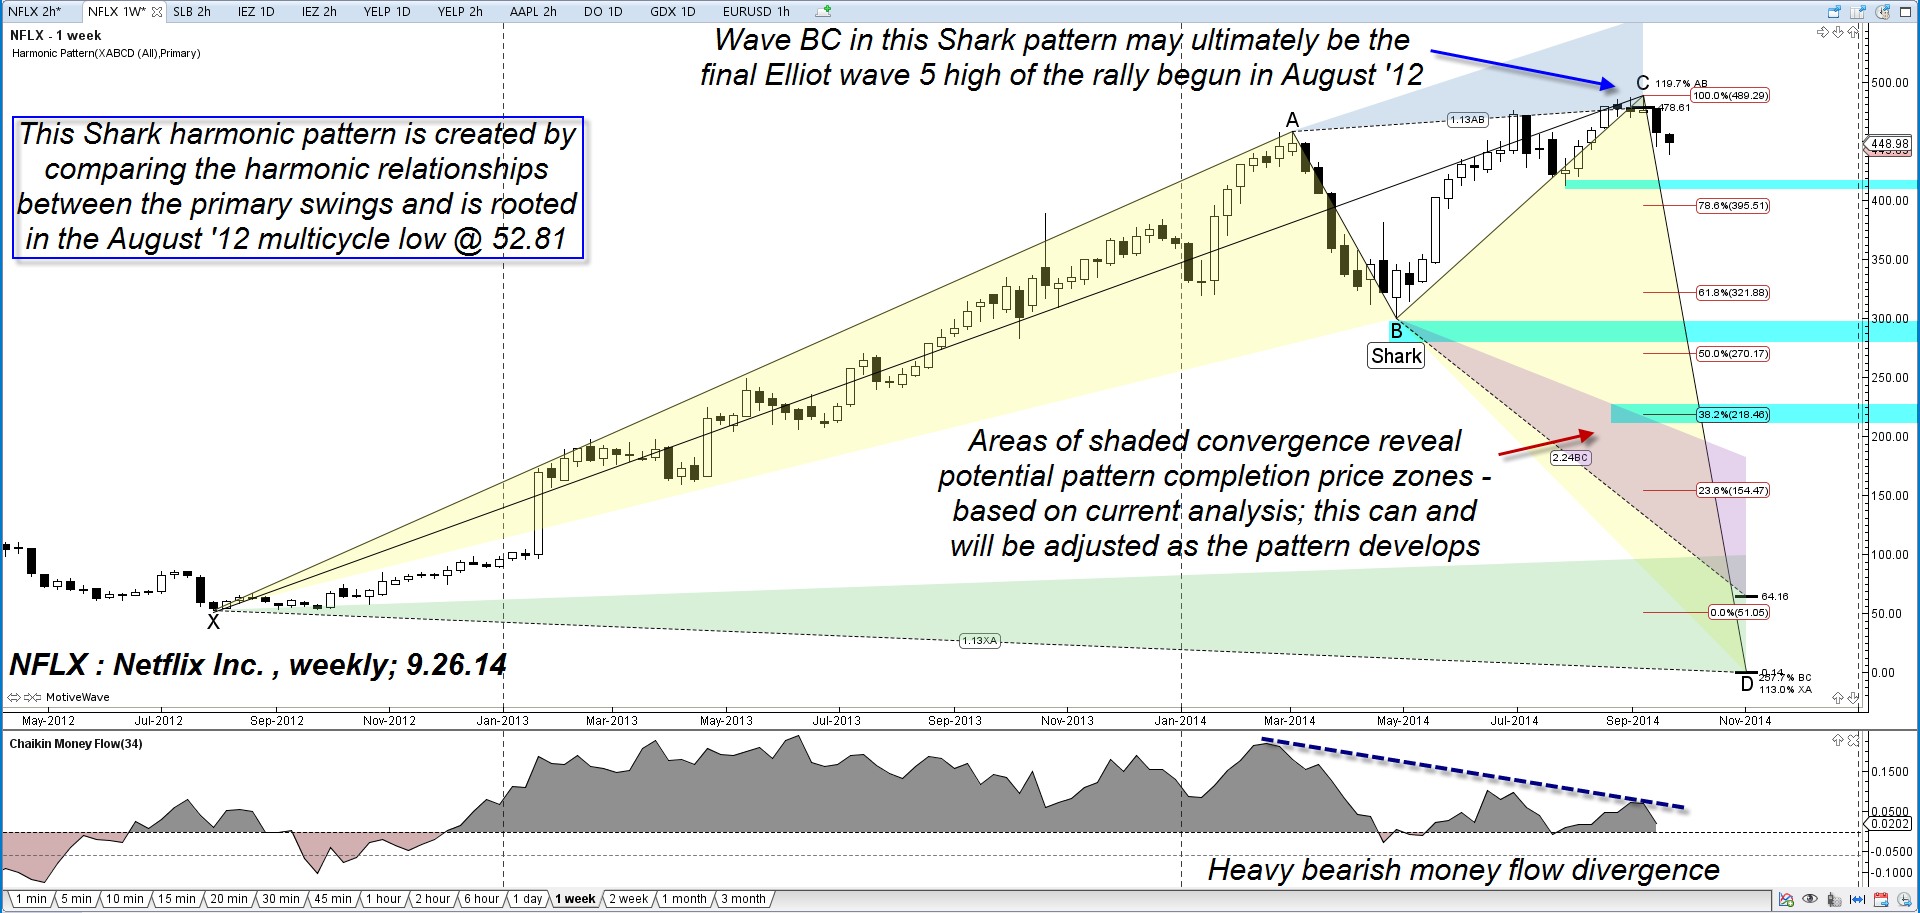
| Trading stocks, futures, and forex markets with the aid of harmonic price patterns can be of immense benefit to traders who seek more accurate ways to forecast future price moves. Here's a look at a fascinating, large-scale harmonic pattern on the weekly chart of Netflix Inc. (NFLX), one that paints a potentially bearish picture for this widely followed issue (see Figure 1). |
|
| Figure 1. Harmonic Pattern In Netflix Inc.(NFLX). When multiple price patterns and technical indicators are warning of a sizeable correction, savvy traders and investors would do well to heed the warnings and avoid media hype, fundamentals, and other distractions. |
| Graphic provided by: MotiveWave.com. |
| |
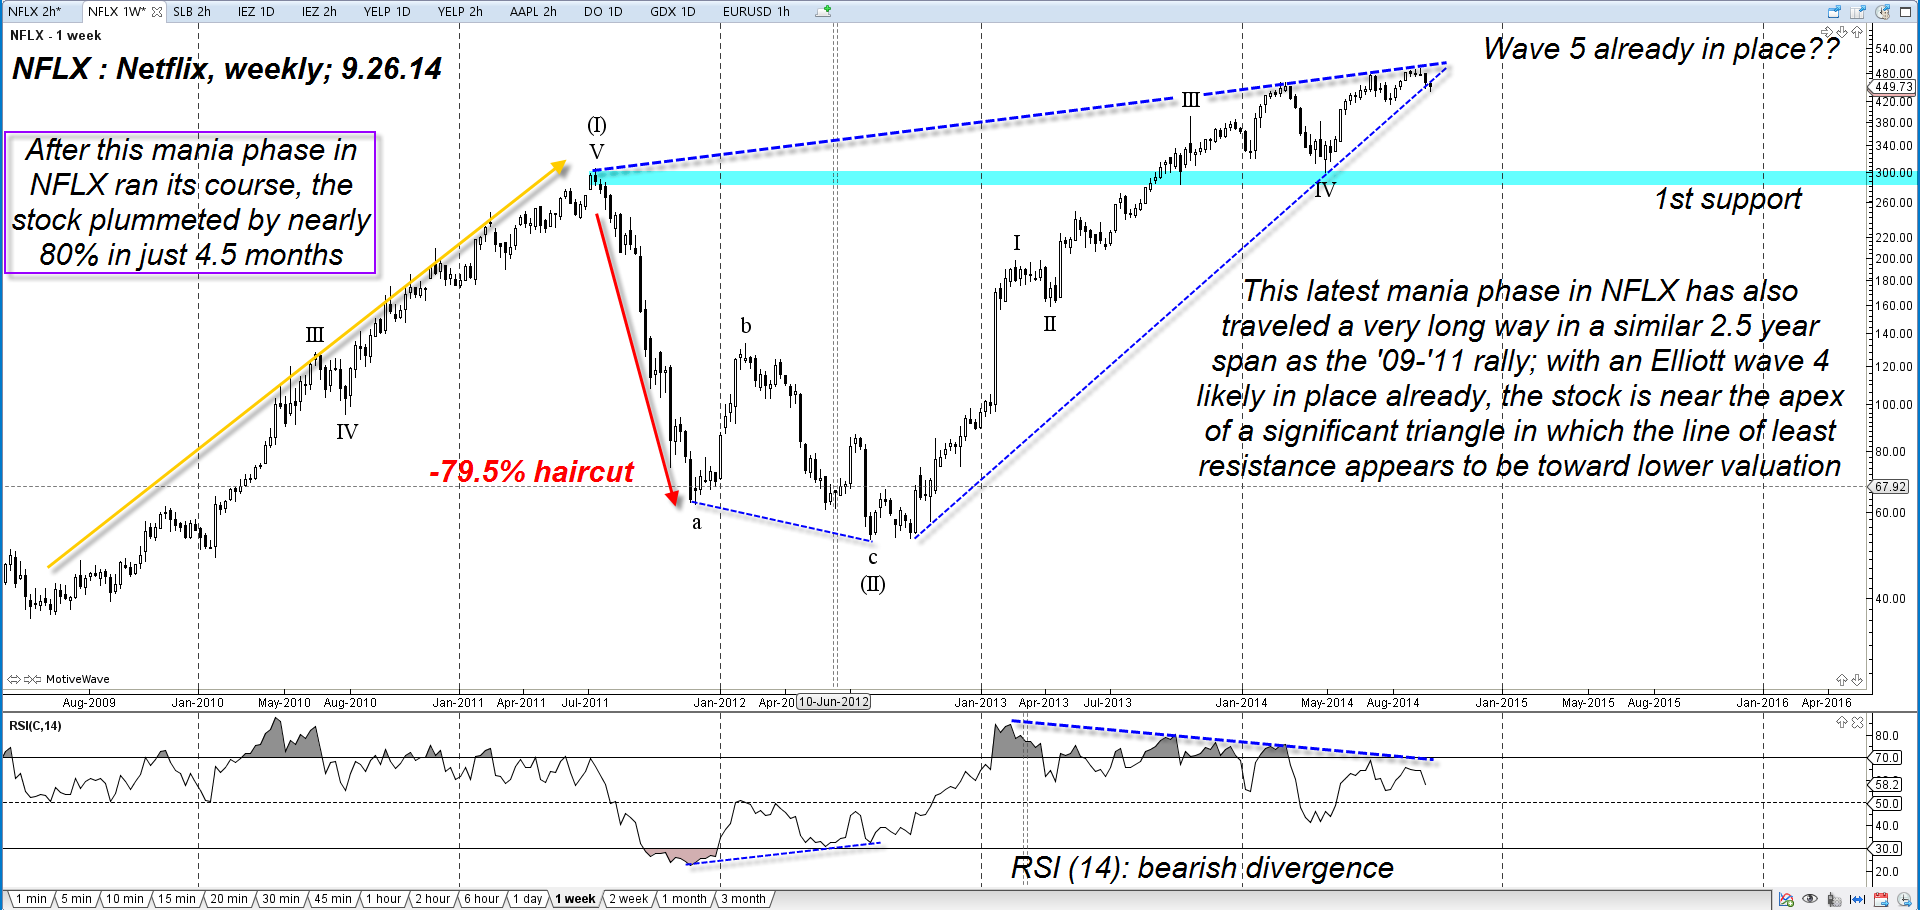
| Like any other kind of chart pattern recognition method - whether initiated by automated scanning or by way of your own two eyes — no two patterns are exactly alike and none are ever perfect. That being said, having logically proportioned harmonic, Fibonacci, and Elliott Wave patterns (Figure 2) working for you as effective leading indicators can be a valuable assist in helping traders stay on the highest probability side of most freely traded markets. Here are the main takeaways from the weekly charts in Figure 1 and Figure 2 of NFLX: 1. The stock is manifesting a clear 'echo' pattern; the current rally is nearly 2.2 years old and has seen the stock surge by 826%; compare this to the 2009-2011 mania that saw NFLX run-up by 741% in a similar 22 month span (May 2009 - July 2011. After the July 2011 high at 304.79 was made, the stock crashed by 79.5% in only 4.5 months; while no one knows if NFLX is due for that big of a correction now, the time/percentage gain equilibrium of both mania phases in the stock are downright creepy. Look out below? 2. The Shark pattern is also warning for the potential of a large-scale correction in NFLX; based on current analysis, there is harmonic convergence for swing CD between 225.00 and 100.00; regardless of how this plays out, that would be at least a 55% correction from today's valuation. 3. Weekly Elliott Wave calculations strongly suggest that NFLX is either in or has already put in the final wave 5 high of the entire rally since July 2013. 4. Note the incredible triangle formation; NFLX appears to be attempting a weekly close beneath the lower boundary, thus cementing the wave 5 high in place. 5. The 34-week Chaikin money flow histogram shows major price/money flow divergence. 6. The RSI(14) depicts steady price/momentum divergence. All in all, the above analysis suggests that it ain't looking like the most opportune time to load up the truck with NFLX shares at the moment. Wait for a sizable correction to occur first; even if NFLX is destined to be a $100 stock by early 2016, there will most likely be tradable bounces on daily and intraday charts that skilled traders can capitalize on. |
|
| Figure 2. Elliott Wave Pattern In NFLX. The Elliott Wave pattern also suggests a high probability for a substantial correction heading into 2015; note that both mania phases in the stock since 2009 have approximately the same time/percentage gain ratio. The post-mania decline in 2011 was nearly 80% and took only 4.5 months to complete. |
| Graphic provided by: MotiveWave.com. |
| |
| For patient, conservative traders/investors, long-term puts (LEAPS) on NFLX looks like a great strategy here — make sure you buy in-the-money (ITM) puts with at least 30-36 months of time value until expiry and then just kick back and watch the show as this overblown market has the air bled out of it throughout 2015 and possibly beyond. Keep your account risk at 2% maximum, no matter how bearish you are on the stock, just in case the stock revives for a final burst higher in this final quarter of 2014. Trade wisely until we meet here again. |
Freelance financial markets writer and online publisher of the Trendzetterz.com S&P 500 Weekly Forecast service.
| Title: | Market consultant and writer |
| Company: | Trendzetterz |
| Address: | 81 Hickory Hollow Drive |
| Crossville, TN 38555 | |
| Phone # for sales: | 904-303-4814 |
| Website: | trendzetterz.com |
| E-mail address: | support@trendzetterz.com |
Traders' Resource Links | |
| Trendzetterz has not added any product or service information to TRADERS' RESOURCE. | |
Click here for more information about our publications!
PRINT THIS ARTICLE

Request Information From Our Sponsors
- StockCharts.com, Inc.
- Candle Patterns
- Candlestick Charting Explained
- Intermarket Technical Analysis
- John Murphy on Chart Analysis
- John Murphy's Chart Pattern Recognition
- John Murphy's Market Message
- MurphyExplainsMarketAnalysis-Intermarket Analysis
- MurphyExplainsMarketAnalysis-Visual Analysis
- StockCharts.com
- Technical Analysis of the Financial Markets
- The Visual Investor
- VectorVest, Inc.
- Executive Premier Workshop
- One-Day Options Course
- OptionsPro
- Retirement Income Workshop
- Sure-Fire Trading Systems (VectorVest, Inc.)
- Trading as a Business Workshop
- VectorVest 7 EOD
- VectorVest 7 RealTime/IntraDay
- VectorVest AutoTester
- VectorVest Educational Services
- VectorVest OnLine
- VectorVest Options Analyzer
- VectorVest ProGraphics v6.0
- VectorVest ProTrader 7
- VectorVest RealTime Derby Tool
- VectorVest Simulator
- VectorVest Variator
- VectorVest Watchdog