HOT TOPICS LIST
- MACD
- Fibonacci
- RSI
- Gann
- ADXR
- Stochastics
- Volume
- Triangles
- Futures
- Cycles
- Volatility
- ZIGZAG
- MESA
- Retracement
- Aroon
INDICATORS LIST
LIST OF TOPICS
PRINT THIS ARTICLE
by Koos van der Merwe
When a well known bear interviewed on Bloomberg or CNBC and shouts, "sell, sell, sell", is it time to buy?
Position: Accumulate
Koos van der Merwe
Has been a technical analyst since 1969, and has worked as a futures and options trader with First Financial Futures in Johannesburg, South Africa.
PRINT THIS ARTICLE
ELLIOTT WAVE
The Bears Have Spoken. Is It Time To Buy?
10/13/14 05:35:16 PMby Koos van der Merwe
When a well known bear interviewed on Bloomberg or CNBC and shouts, "sell, sell, sell", is it time to buy?
Position: Accumulate
| Being a contrarian is not easy, especially when a well-known frequently quoted analyst shouts that it is time to sell all your stocks and move into cash. Many will follow this advice, and the indexes will drop strongly, but in today's world, where computers are taking over market trading more and more as they become even more efficient, the indexes may not fall to the prediction. History for contrarians has taught them when everyone sells, then it is time to buy, and vice versa, so with the well known bears standing on their wooden boxes and shouting sell, is it time to buy? The only problem is that they have been shouting, "Sell, the market is crashing" for the last two years. One day they will be correct, and then they will shout, "See, we told you so." |

|
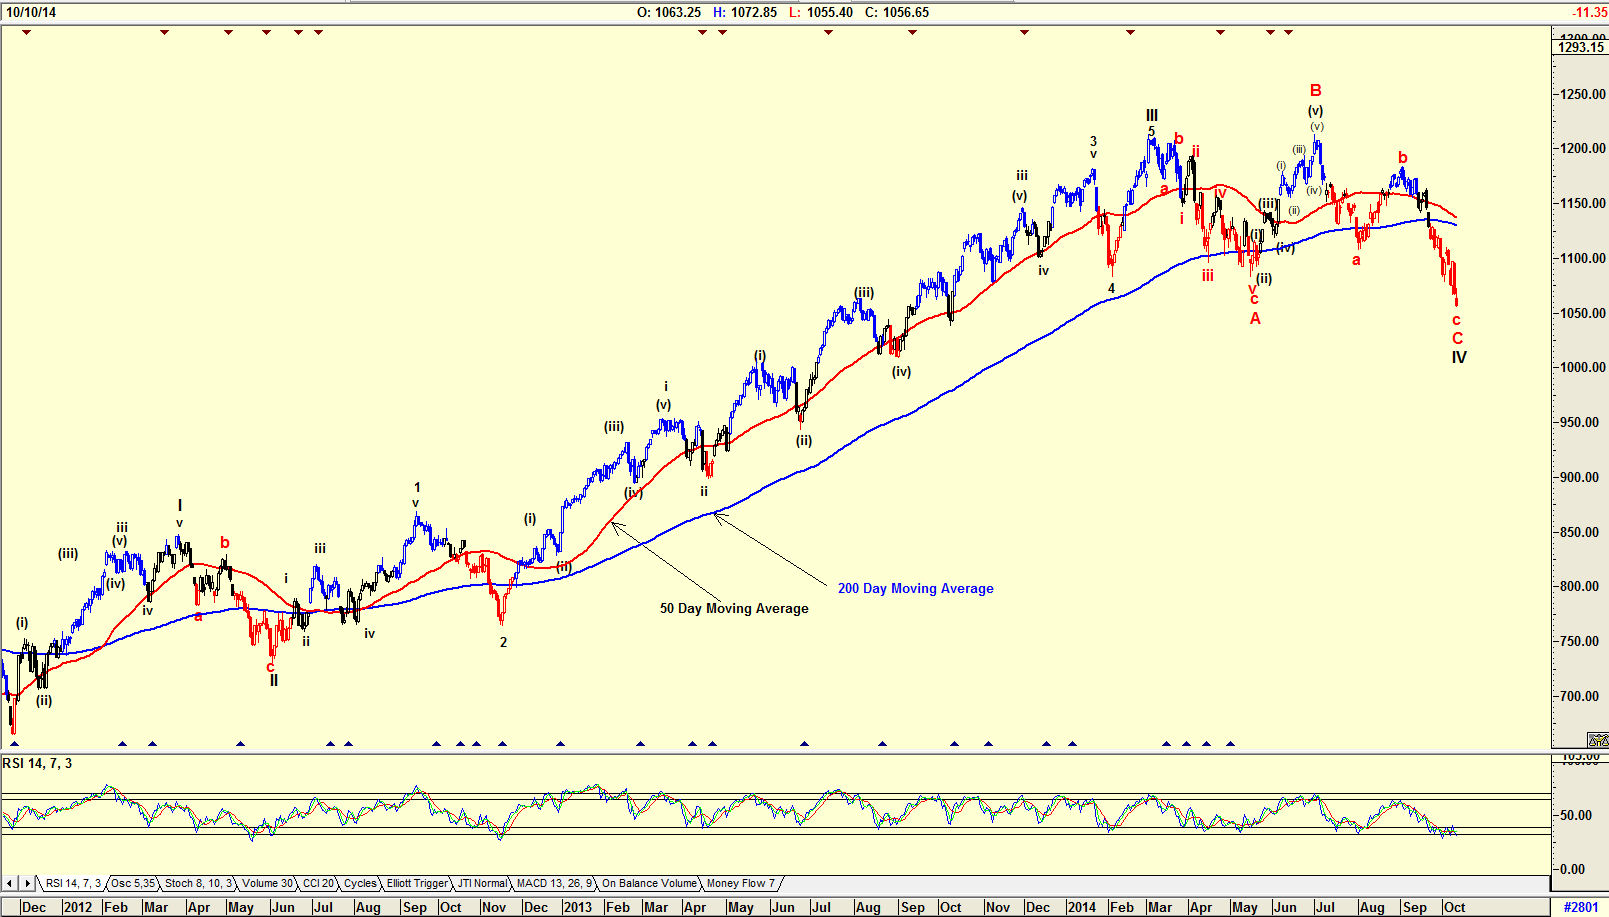
| Figure 1. Elliott Waves. Here you see the daily chart of the Russell 2000 index with Elliott Wave count overlaid on it. |
| Graphic provided by: AdvancedGET. |
| |
| The chart in Figure 1 is a daily chart of the Russell 2000 index with an Elliott Wave count suggesting that the index is completing a Major WAVE IV. The index has fallen through the 50- and 200-day moving averages and history has shown that when this occurs, a reversal could be on the cards. This is confirmed by the relative strength index (RSI) which is at oversold levels, but has not yet suggested a buy by breaking strongly above the 30 horizontal line. The question is will the index reverse up quickly with strength or will it move sideways forming a base? |

|
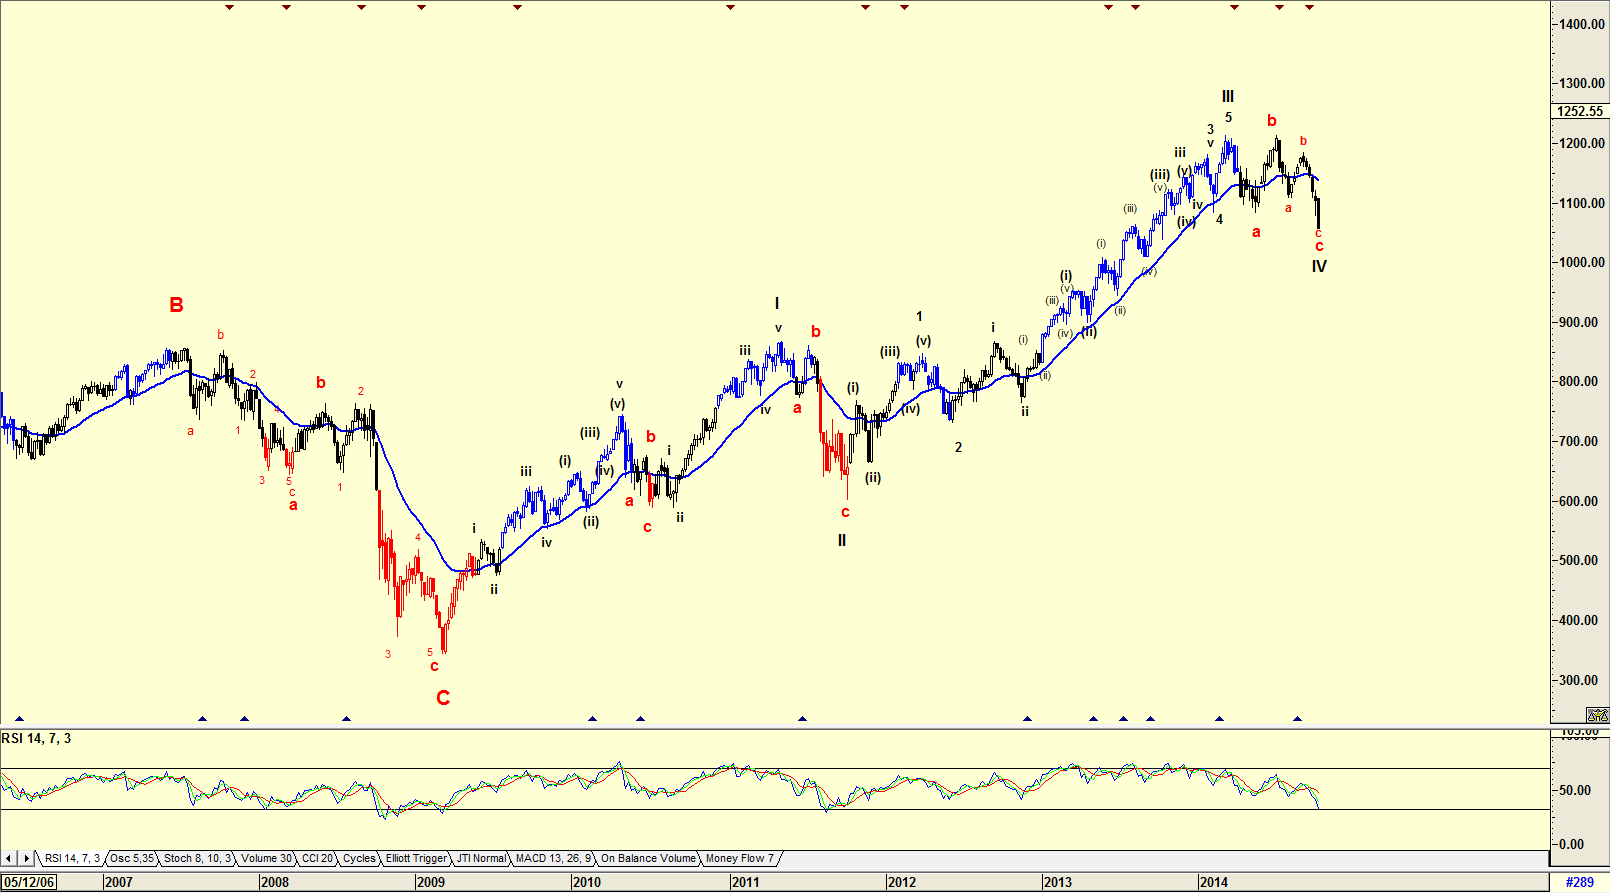
| Figure 2. Is It A Bottom? Weekly chart of the Russell 2000 index with Elliott Wave count suggesting a WAVE IV bottom. |
| Graphic provided by: AdvancedGET. |
| |
| The chart in Figure 2 is a weekly chart of the Russell 2000 index suggesting that the index is in a WAVE IV correction. The RSI is suggesting that the index could fall further, but it is near the bottom suggesting that a buy signal could occur during the next few weeks. |

|
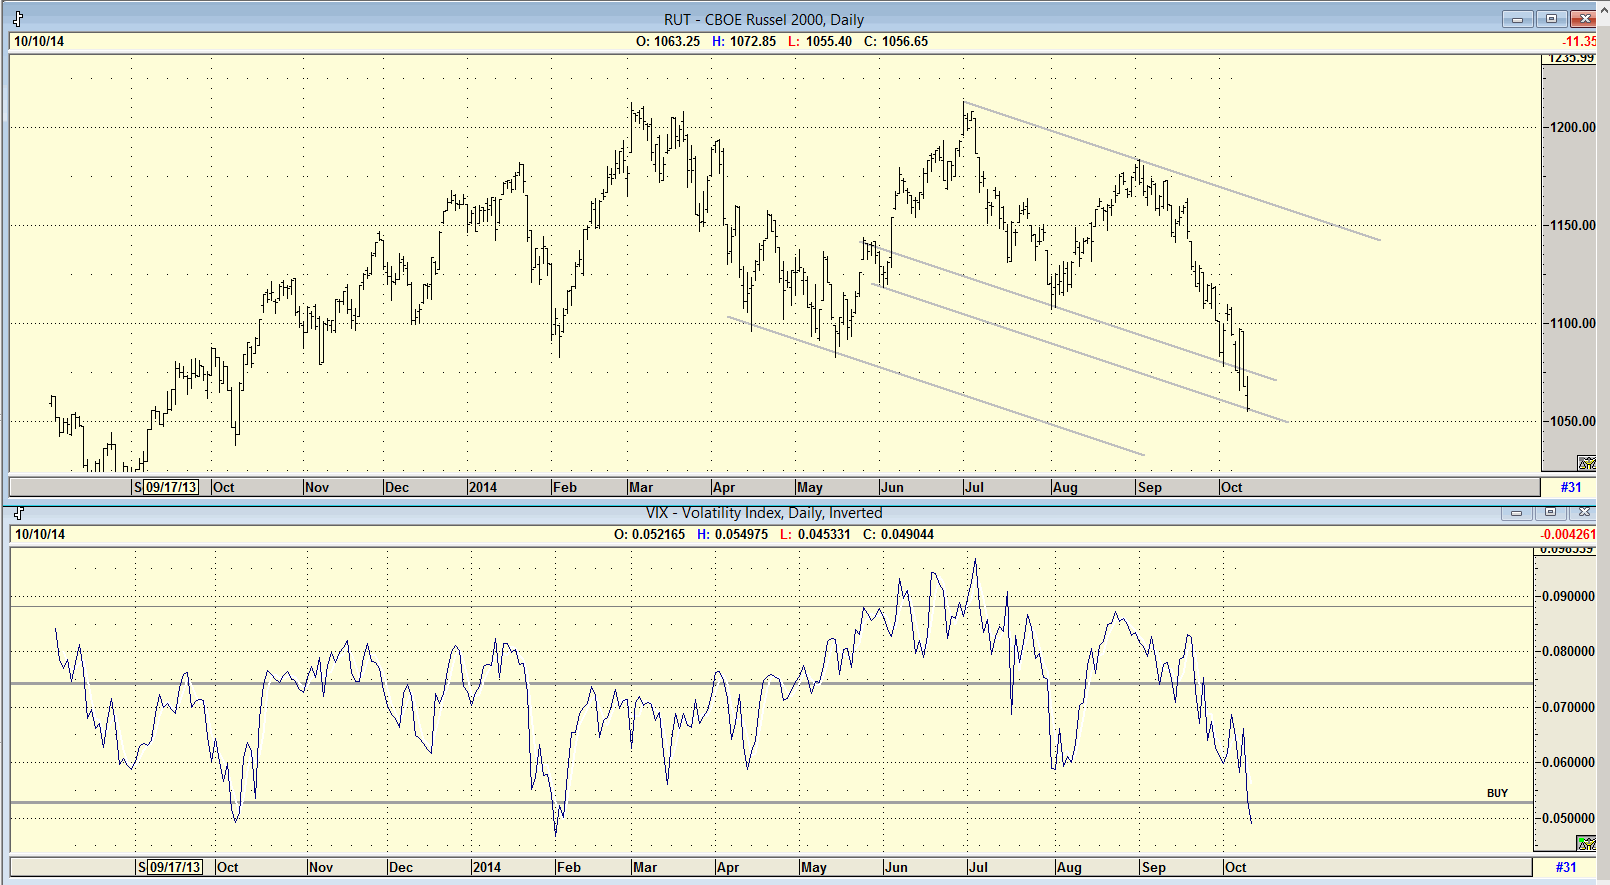
| Figure 3. A Buy Signal? Here you see a chart of the Russell 2000 index with the inverted VIX in the subchart below the price chart. The inverted VIX ix suggesting that a buy signal could start developing soon. |
| Graphic provided by: AdvancedGET. |
| |
| The chart in Figure 3 is a chart of the Russell 2000 index with the inverted volatility index (VIX). Note that whenever the inverted VIX falls below the lower horizontal line a bottom in the index is triggered. The inverted VIX is suggesting that a buy signal could start developing in the near future. In my article written on September 22, 2014 titled "A Look At The Indexes", I concluded, "Yes, a correction and what could be a strong one is due, however whether it actually occurs depends on... no-one actually knows but when it does occur, many will claim that they knew." Being a contrarian and a cynic is not easy, especially in times of uncertainty. With the world in upheaval; the Middle East and the Ebola crisis a strong challenge, is cash not the way to go? To the unsophisticated investor it is. To the sophisticated trader, it is an opportunity to buy. |
Has been a technical analyst since 1969, and has worked as a futures and options trader with First Financial Futures in Johannesburg, South Africa.
| Address: | 3256 West 24th Ave |
| Vancouver, BC | |
| Phone # for sales: | 6042634214 |
| E-mail address: | petroosp@gmail.com |
Click here for more information about our publications!
Comments
Date: 10/16/14Rank: 5Comment:

Request Information From Our Sponsors
- VectorVest, Inc.
- Executive Premier Workshop
- One-Day Options Course
- OptionsPro
- Retirement Income Workshop
- Sure-Fire Trading Systems (VectorVest, Inc.)
- Trading as a Business Workshop
- VectorVest 7 EOD
- VectorVest 7 RealTime/IntraDay
- VectorVest AutoTester
- VectorVest Educational Services
- VectorVest OnLine
- VectorVest Options Analyzer
- VectorVest ProGraphics v6.0
- VectorVest ProTrader 7
- VectorVest RealTime Derby Tool
- VectorVest Simulator
- VectorVest Variator
- VectorVest Watchdog
- StockCharts.com, Inc.
- Candle Patterns
- Candlestick Charting Explained
- Intermarket Technical Analysis
- John Murphy on Chart Analysis
- John Murphy's Chart Pattern Recognition
- John Murphy's Market Message
- MurphyExplainsMarketAnalysis-Intermarket Analysis
- MurphyExplainsMarketAnalysis-Visual Analysis
- StockCharts.com
- Technical Analysis of the Financial Markets
- The Visual Investor
