

HOT TOPICS LIST
- MACD
- Fibonacci
- RSI
- Gann
- ADXR
- Stochastics
- Volume
- Triangles
- Futures
- Cycles
- Volatility
- ZIGZAG
- MESA
- Retracement
- Aroon
INDICATORS LIST
LIST OF TOPICS
PRINT THIS ARTICLE
by Koos van der Merwe
The charts of the three indexes are suggesting a correction. How much of a correction? Let's find out.
Position: Sell
Koos van der Merwe
Has been a technical analyst since 1969, and has worked as a futures and options trader with First Financial Futures in Johannesburg, South Africa.
PRINT THIS ARTICLE
ELLIOTT WAVE
A Look At The Indexes
09/25/14 05:17:17 PMby Koos van der Merwe
The charts of the three indexes are suggesting a correction. How much of a correction? Let's find out.
Position: Sell
| Looking at charts of the Dow Jones Industrial Average (DJIA), the S&P 500, and the Nasdaq index, it looks as though a major correction is due. The correction will not be a "bubble burst" which is something that continually disturbs investors, but it will be a strong correction that is likely to scare many investors. The cause could be anything from USA sending troops to fight ISIS, to Russia invading the Ukraine. Who knows? But there will be many who will stand on their soap box once the correction starts and shout, "You see, we told you!" |
|
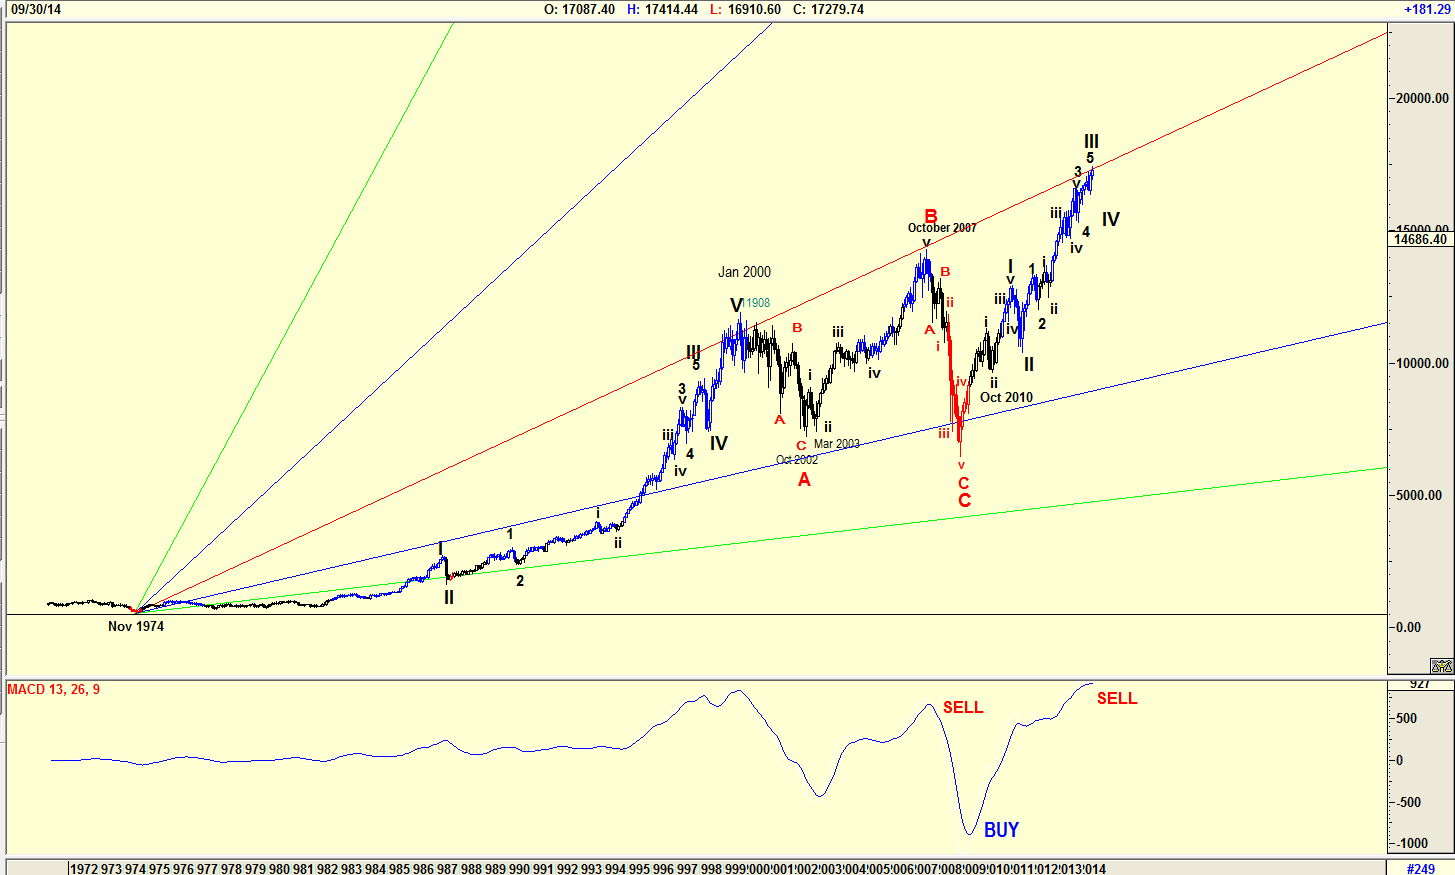
| Figure 1. Here you see a chart of the Dow Jones Industrial Average with a Gann fan overlaid on the price chart. |
| Graphic provided by: AdvancedGET. |
| |
| The chart in Figure 1 is a monthly chart of the DJIA, from November 1974 to today. Drawing a Gann fan from the low in November 1974 has a 1x1 angle catching the market tops of January 2000 and October 2007. With the index presently testing the 1x1 angle, a correction is suggested. An Elliott wave count is suggesting that a major WAVE III is complete and a major WAVE IV should now happen. Note that the MACD indicator is in the process of giving a sell signal. |
|
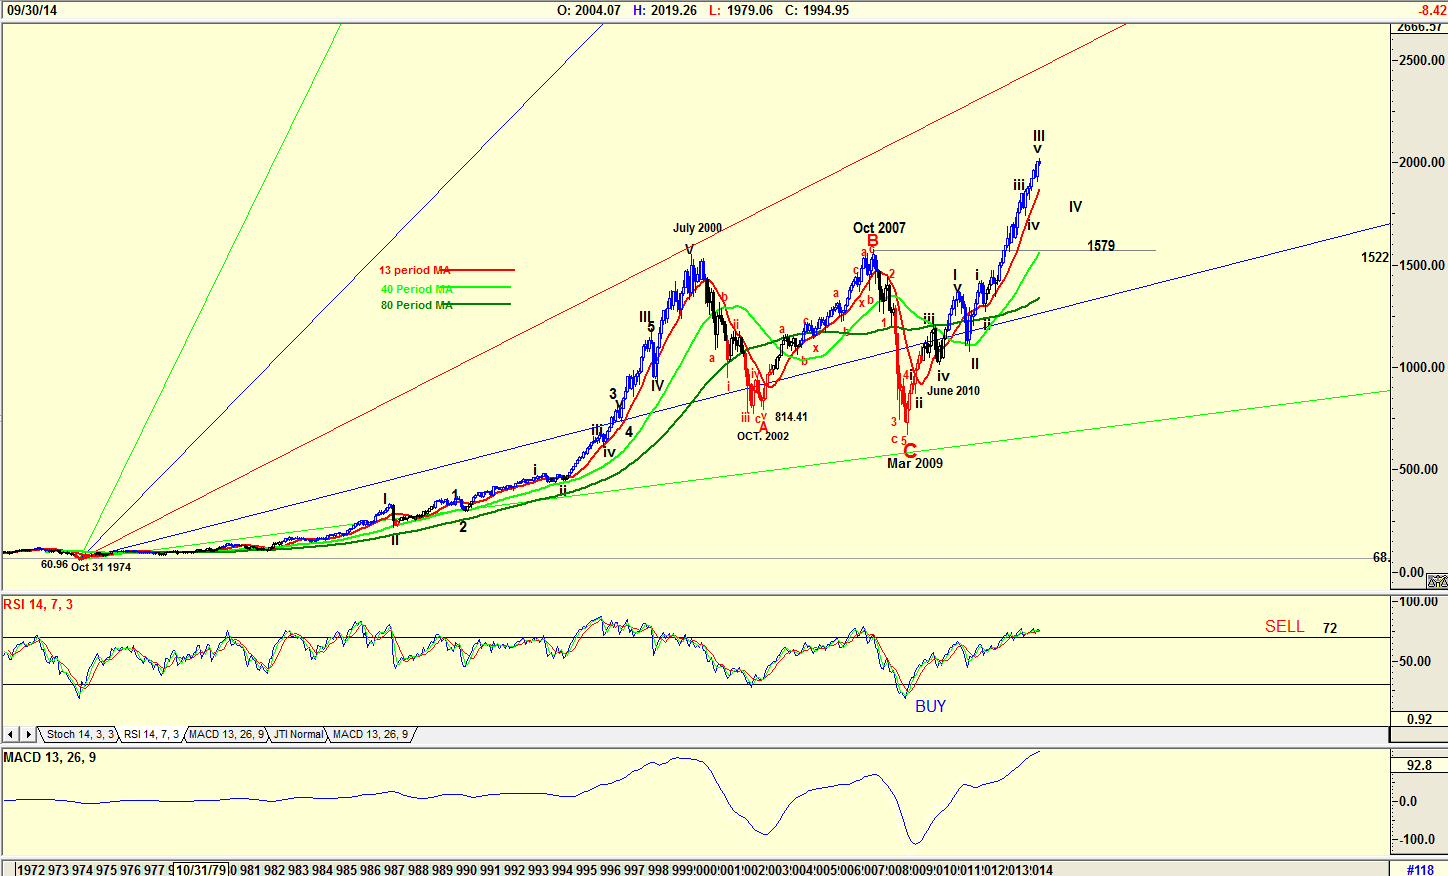
| Figure 2. Here you see a chart of the S&P 500 index with a Gann fan. |
| Graphic provided by: AdvancedGET. |
| |
| A Gann fan on the S&P 500 does not show a WAVE III flirting with the 1x1 angle but it does show an Elliott wave count showing that the index is in a major WAVE III. The relative strength index (RSI) is overbought but has not given a sell signal by breaking below the 72 horizontal line. The moving average convergence divergence (MACD) indicator has also not given a sell signal, but the chart suggests that it could in the near future. |
|
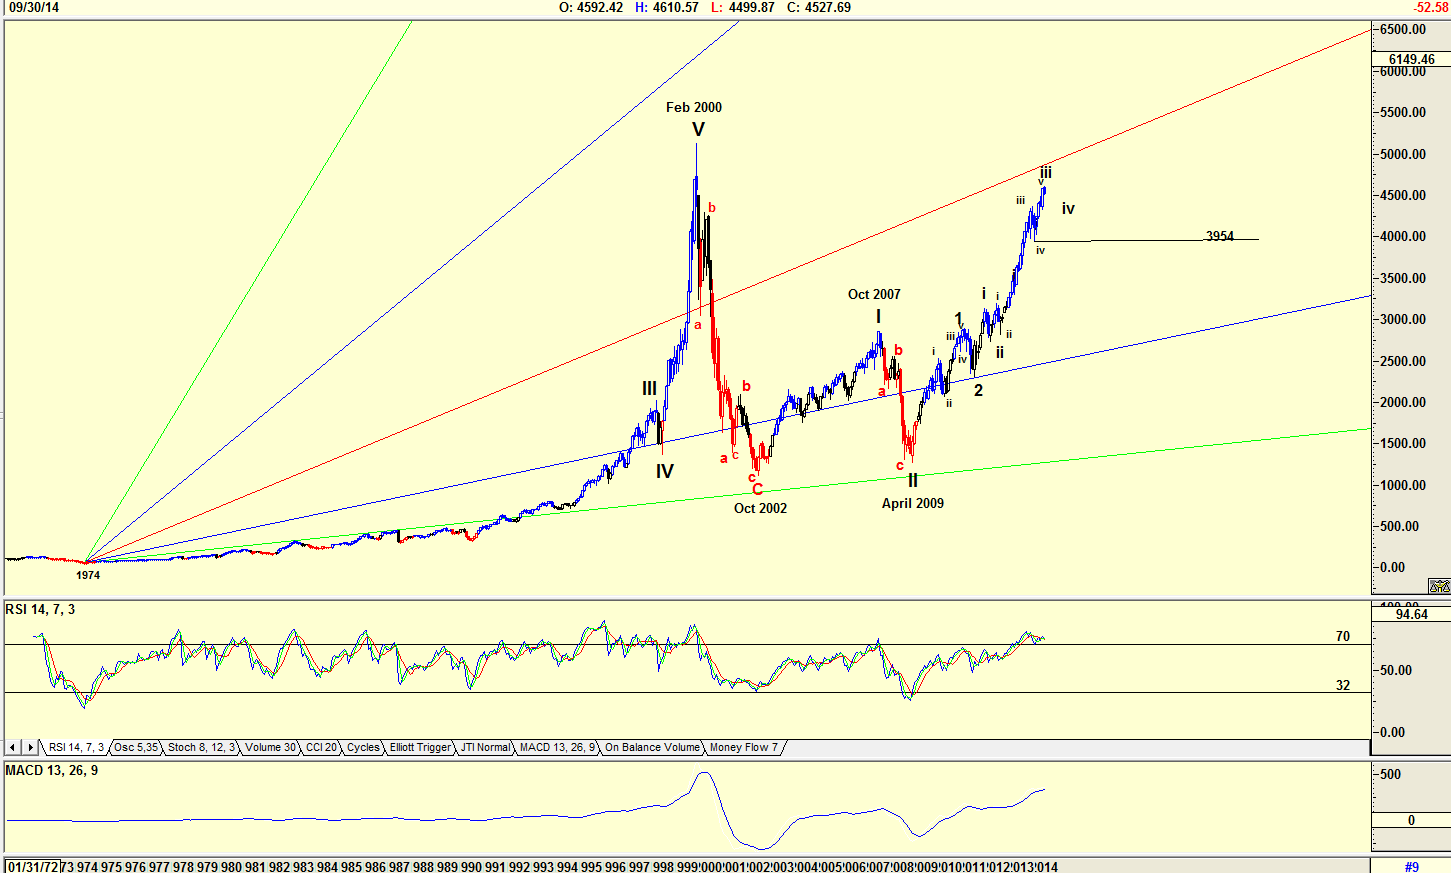
| Figure 3. Here you see a chart of the Nasdaq index with a Gann fan. |
| Graphic provided by: AdvancedGET. |
| |
| The chart of the Nasdaq index displayed in Figure 3 has a Gann fan that, similar to the S&P500 index, did not catch the highs and lows as did the Gann fan of the DJIA in Figure 1. The index also has an Elliott wave count suggesting that the correction will not be as dramatic as that of the DJIA, with the 4th wave of lesser degree in the region of 3954. The RSI is at overbought levels. Also note that the MACD is still rising. |
|
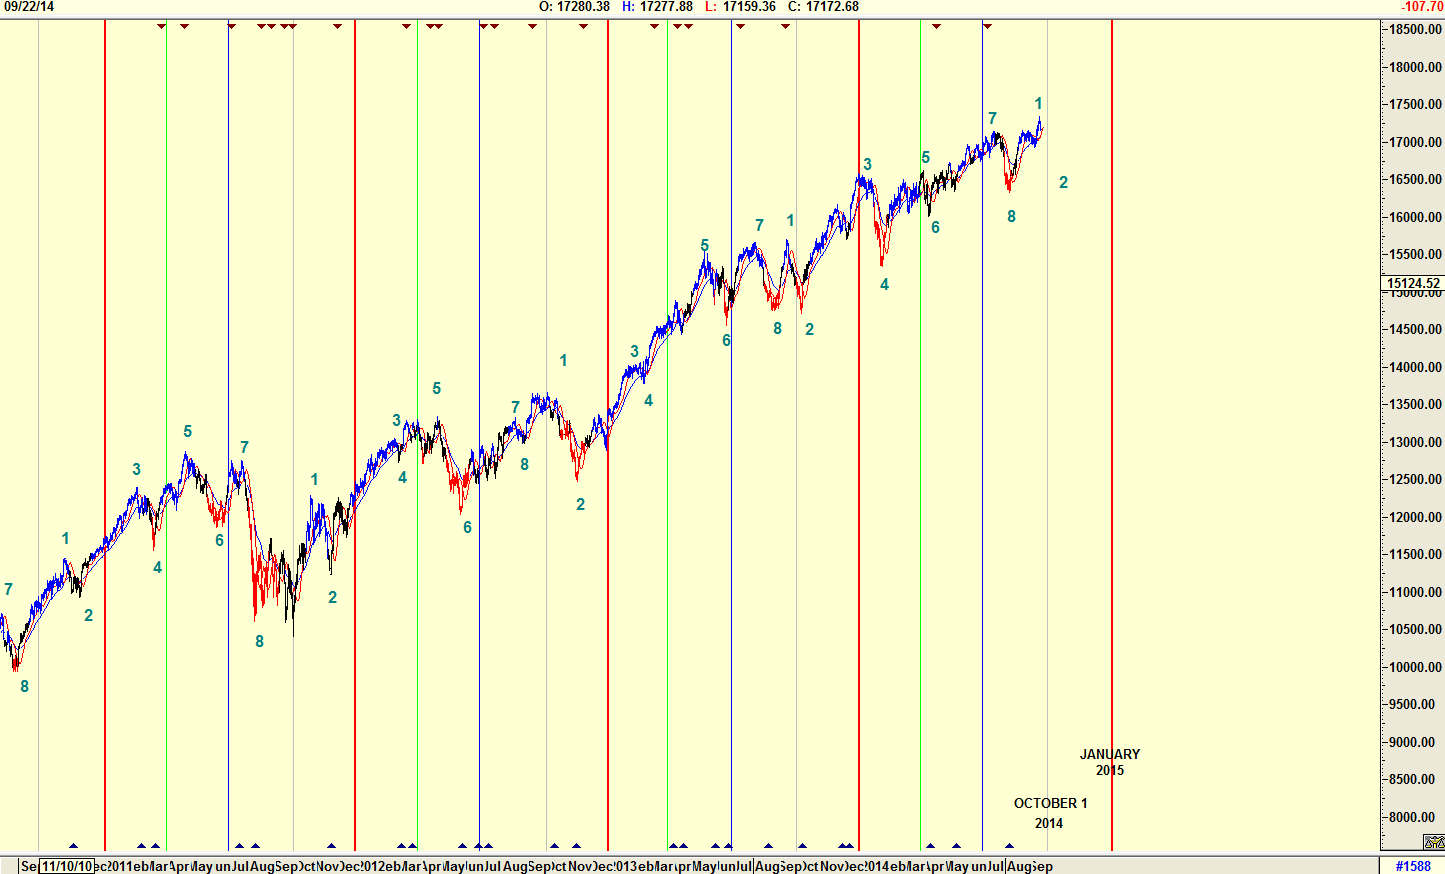
| Figure 4. Here you see a daily chart of the Dow Jones Industrial Average with Paget cycles. |
| Graphic provided by: AdvancedGET. |
| |
| The charts are confusing. The DJIA is suggesting a strong correction is due. The S&P 500 and the Nasdaq index are also suggesting a correction, but not as strong as that of the DJIA. The chart in Figure 4 is a daily chart of the DJIA showing a Paget cycle. A Paget cycle is where every three months Paget would draw a vertical line. He would then number the highs and lows as shown on the chart and look for a repetition of the trend. The chart is suggesting a correction in the Dow into mid-October or beginning of November. The correction could be large or it could be small, but a correction is due. Yes, a correction, perhaps a strong one, is due but whether it will occur depends on...well, nobody really knows but when it does occur, many will claim that they knew. Yes, the correction will occur, but it is also an opportunity to buy the shares you would like to own. Watch it carefully and look for that bottom. |
Has been a technical analyst since 1969, and has worked as a futures and options trader with First Financial Futures in Johannesburg, South Africa.
| Address: | 3256 West 24th Ave |
| Vancouver, BC | |
| Phone # for sales: | 6042634214 |
| E-mail address: | petroosp@gmail.com |
Click here for more information about our publications!
PRINT THIS ARTICLE

Request Information From Our Sponsors
- StockCharts.com, Inc.
- Candle Patterns
- Candlestick Charting Explained
- Intermarket Technical Analysis
- John Murphy on Chart Analysis
- John Murphy's Chart Pattern Recognition
- John Murphy's Market Message
- MurphyExplainsMarketAnalysis-Intermarket Analysis
- MurphyExplainsMarketAnalysis-Visual Analysis
- StockCharts.com
- Technical Analysis of the Financial Markets
- The Visual Investor
- VectorVest, Inc.
- Executive Premier Workshop
- One-Day Options Course
- OptionsPro
- Retirement Income Workshop
- Sure-Fire Trading Systems (VectorVest, Inc.)
- Trading as a Business Workshop
- VectorVest 7 EOD
- VectorVest 7 RealTime/IntraDay
- VectorVest AutoTester
- VectorVest Educational Services
- VectorVest OnLine
- VectorVest Options Analyzer
- VectorVest ProGraphics v6.0
- VectorVest ProTrader 7
- VectorVest RealTime Derby Tool
- VectorVest Simulator
- VectorVest Variator
- VectorVest Watchdog