HOT TOPICS LIST
- MACD
- Fibonacci
- RSI
- Gann
- ADXR
- Stochastics
- Volume
- Triangles
- Futures
- Cycles
- Volatility
- ZIGZAG
- MESA
- Retracement
- Aroon
INDICATORS LIST
LIST OF TOPICS
PRINT THIS ARTICLE
by Donald W. Pendergast, Jr.
Shares of Intel Corp. gained 50% from early February to late August 2014 and are now vulnerable to a correction.
Position: N/A
Donald W. Pendergast, Jr.
Freelance financial markets writer and online publisher of the Trendzetterz.com S&P 500 Weekly Forecast service.
PRINT THIS ARTICLE
CHART ANALYSIS
INTC: Getting Toppy?
09/02/14 04:03:16 PMby Donald W. Pendergast, Jr.
Shares of Intel Corp. gained 50% from early February to late August 2014 and are now vulnerable to a correction.
Position: N/A
| Companies with healthy fundamentals — particularly those with increasing earnings and sales growth rates — tend to see their stock prices perform better than the market as a whole. However, when prices get overextended due to irrational exuberance (greed) a correction, or even a trend reversal, takes place. And ironically, it's usually when a stock has fantastic fundamentals that such corrections/reversals get underway. Here's a look at Intel's fundamentals along with a glance at its weekly chart (Figure 2), one that strongly suggests that existing longs begin to take profits or buy protective puts. |

|
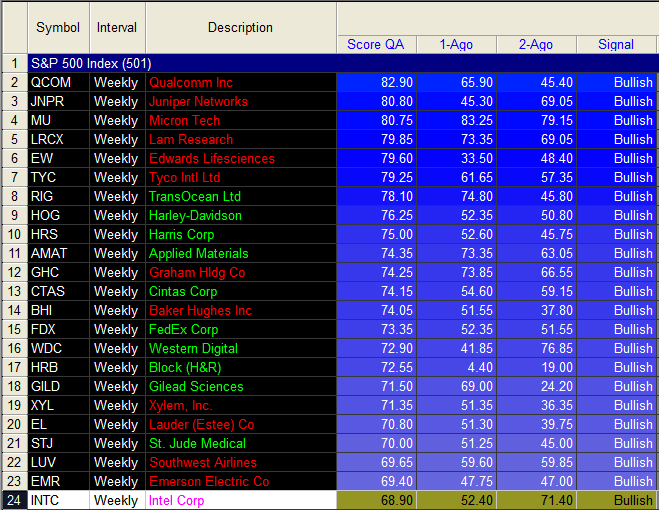
| Figure 1. Intel Corp. (INTC) is one of only 79 other .SPX components with bullish fundamental scores. Bearish fundamental stocks are outweighing bullish ones by a factor of more than 2.37 to 1, not a good sign at an all-time high in the .SPX. |
| Graphic provided by: TradeStation. |
| Graphic provided by: TradeStation RadarScreen. |
| |
| Once its weekly cycle low of February 7, 2014 was in place, shares of Intel Corp. (INTC) traded in a narrow range for several weeks before its powerful, multimonth ascent commenced — a bullish run that ultimately gained 50% in the course of 28 weeks. The stock's fundamental score got progressively more bullish as the uptrend gathered steam and as of this writing still has a bullish score of 68.20. This is up from last week's reading of 52.40 but down from two weeks ago when it was 71.40. The TradeStation Fundamental Score radar screen ranks stocks according to eight key fundamental measures; I have modified it to place extra weight on the earnings per share category. Generally speaking, if wishing to buy stocks during bullish broad market phases, you would focus on the stocks with bright blue cells (bullish) and shun those with gray (flat) or red (bearish) cells. You'll still need some sort of technical trigger to get you into — and out of — your trades but using the fundamental scores can alert you to strengthening/weakening fundamentals even as your chosen technical indicators and relative strength rankings can warn you of divergences, stalls, corrections, and outright reversals. Using fundamentals and technicals in concert makes a lot of sense, especially for those who are long-term trend followers and value stock investors. Before getting into INTC's technicals, however, be advised that the fundamental score radar screen is beginning to paint a progressively more bearish picture for the S&P 500 index (.SPX, SPY) components: 1. Only 16% of all .SPX issues have bullish fundamental scores. 2. Nearly 38% of .SPX issues have bearish fundamental scores. 3. A full 46% of .SPX issues have neutral (flat) scores. To see such a lopsided bearish bias among large cap stocks at a time of a new record high is hardly reassuring; as mentioned in my recent TCA article on Southwest Airlines, "The ratio of bullish/bearish moving average confluences among big-name stocks is tilted toward an absurdly bullish extreme at the moment. Another round of retail investor 'sheep shearing' approacheth." The upshot here is that something wicked this way cometh, and from all appearances, it's another nasty correction in the .SPX as we head into autumn 2014. |

|
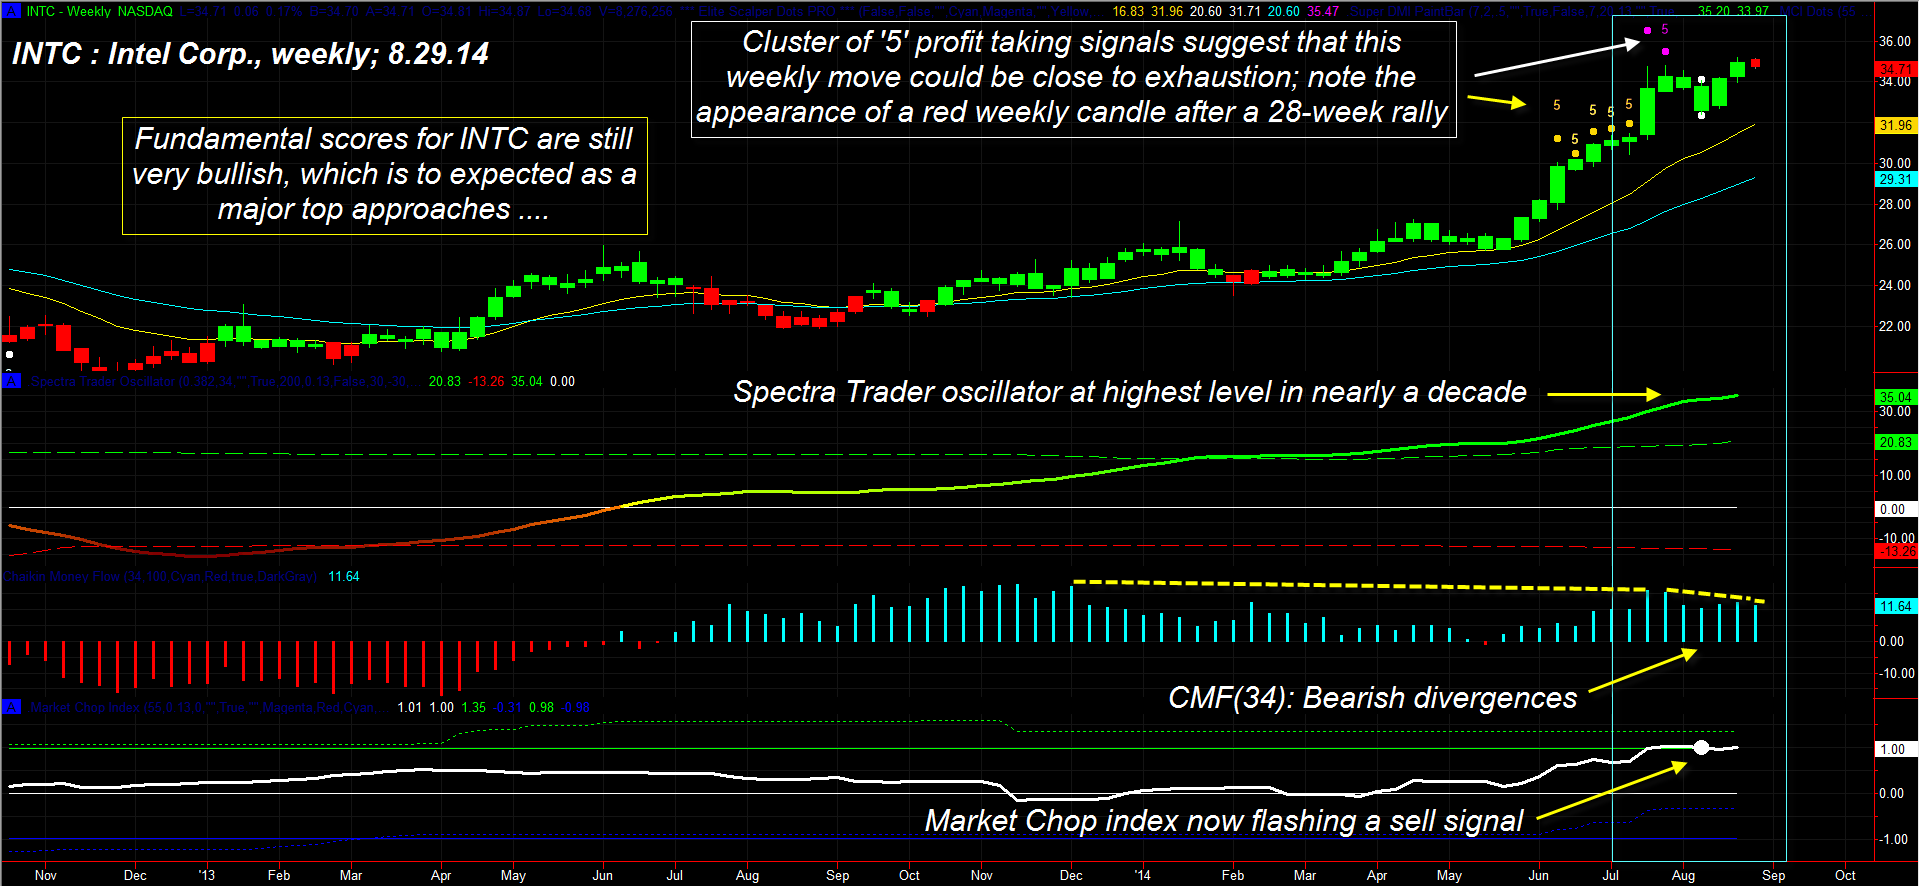
| Figure 2. The weekly chart of INTC reveals bearish money flow divergence, multiple profit taking warnings, a super-overextended trend indicator, and an outright weekly sell signal. |
| Graphic provided by: TradeStation. |
| Graphic provided by: Elite Trader Indicators by Fibozachi.com. |
| |
| Okay, here are the technical warning signs on INTC's weekly chart in Figure 2: 1. The moving average spread is at one of its most extreme readings of the last 10 years. 2. The 34-week Chaikin Money Flow histogram (CMF)(34) is manifesting a bearish divergence of two separate degrees. 3. The Spectra Trader oscillator is at its highest level in nearly a decade. 4. The Market Chop index (bottom of chart) has issued a sell signal for existing weekly longs in INTC. 5. Finally, note the cluster of six '5' profit taking signals that appeared just before the August 22, 2014 high. In combination, the fundamental and technical message here for INTC is plain and simple: A. Existing weekly longs should already be scaling out, running a closer trailing stop and/or buying protective put options. B. As INTC is still considered a Nasdaq 100 (.NDX, QQQ) and S&P 500 (.SPX, SPY) bellwether stock, traders and investors should also be employing the wisdom of point A to protect all of their long positions in the US stock market. The Fed's money creation extravaganza of 2009-2014 has been the primary catalyst for the stupendous recovery gains of the past 66 months; once this desperate, fundamentally- and fatally-flawed market engineering tactic ends (and it will end, being structurally unsustainable), this market will likely experience the biggest correction/crash of the past 85 years. Make sure you are especially mindful of this every time the market gets to another overheated juncture as we see right now. Trade wisely until we meet here again. |
Freelance financial markets writer and online publisher of the Trendzetterz.com S&P 500 Weekly Forecast service.
| Title: | Market consultant and writer |
| Company: | Trendzetterz |
| Address: | 81 Hickory Hollow Drive |
| Crossville, TN 38555 | |
| Phone # for sales: | 904-303-4814 |
| Website: | trendzetterz.com |
| E-mail address: | support@trendzetterz.com |
Traders' Resource Links | |
| Trendzetterz has not added any product or service information to TRADERS' RESOURCE. | |
Click here for more information about our publications!
PRINT THIS ARTICLE

Request Information From Our Sponsors
- StockCharts.com, Inc.
- Candle Patterns
- Candlestick Charting Explained
- Intermarket Technical Analysis
- John Murphy on Chart Analysis
- John Murphy's Chart Pattern Recognition
- John Murphy's Market Message
- MurphyExplainsMarketAnalysis-Intermarket Analysis
- MurphyExplainsMarketAnalysis-Visual Analysis
- StockCharts.com
- Technical Analysis of the Financial Markets
- The Visual Investor
- VectorVest, Inc.
- Executive Premier Workshop
- One-Day Options Course
- OptionsPro
- Retirement Income Workshop
- Sure-Fire Trading Systems (VectorVest, Inc.)
- Trading as a Business Workshop
- VectorVest 7 EOD
- VectorVest 7 RealTime/IntraDay
- VectorVest AutoTester
- VectorVest Educational Services
- VectorVest OnLine
- VectorVest Options Analyzer
- VectorVest ProGraphics v6.0
- VectorVest ProTrader 7
- VectorVest RealTime Derby Tool
- VectorVest Simulator
- VectorVest Variator
- VectorVest Watchdog
